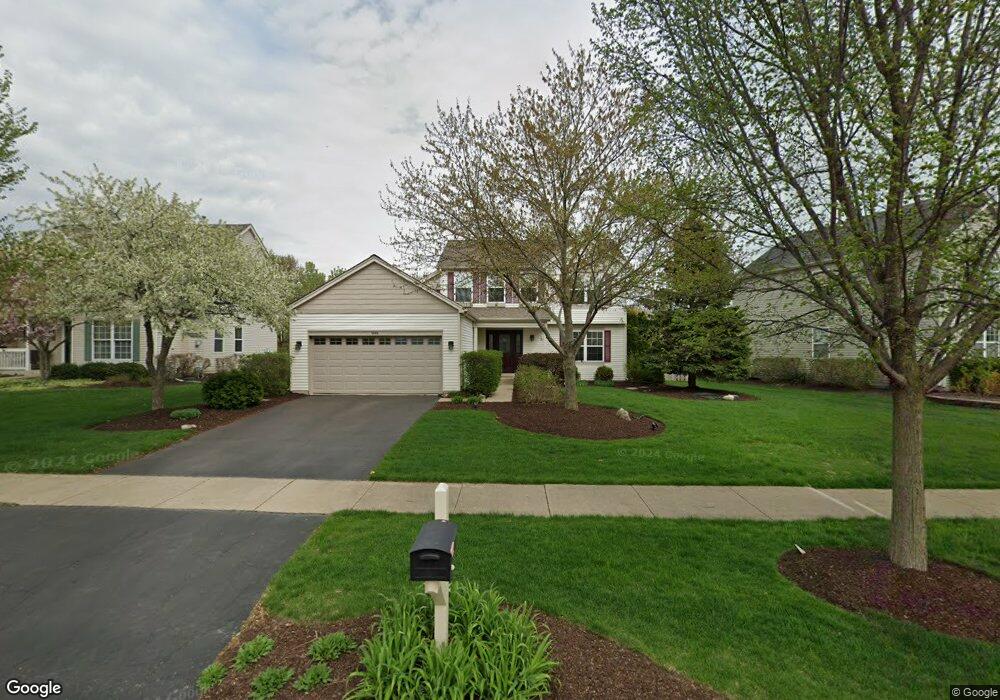
949 Wilkinson Ln North Aurora, IL 60542
Estimated Value: $385,657 - $437,000
3
Beds
3
Baths
1,890
Sq Ft
$220/Sq Ft
Est. Value
About This Home
This home is located at 949 Wilkinson Ln, North Aurora, IL 60542 and is currently estimated at $416,414, approximately $220 per square foot. 949 Wilkinson Ln is a home located in Kane County with nearby schools including Fearn Elementary School, Jewel Middle School, and West Aurora High School.
Ownership History
Date
Name
Owned For
Owner Type
Purchase Details
Closed on
Mar 30, 2004
Sold by
Mancini Vincent C and Mancini Shelby A
Bought by
Vanderwal Charles
Current Estimated Value
Home Financials for this Owner
Home Financials are based on the most recent Mortgage that was taken out on this home.
Original Mortgage
$25,200
Interest Rate
4%
Mortgage Type
Credit Line Revolving
Purchase Details
Closed on
Aug 17, 2001
Sold by
Mancini Vincent C and Mancini Shelby A
Bought by
Mancini Vincent C and Mancini Shelby A
Purchase Details
Closed on
Mar 28, 2000
Sold by
Neumann Homes Inc
Bought by
Mancini Vincent C and Walker Shelby A
Home Financials for this Owner
Home Financials are based on the most recent Mortgage that was taken out on this home.
Original Mortgage
$149,800
Interest Rate
8.31%
Create a Home Valuation Report for This Property
The Home Valuation Report is an in-depth analysis detailing your home's value as well as a comparison with similar homes in the area
Home Values in the Area
Average Home Value in this Area
Purchase History
| Date | Buyer | Sale Price | Title Company |
|---|---|---|---|
| Vanderwal Charles | $252,000 | Chicago Title Insurance Comp | |
| Mancini Vincent C | -- | -- | |
| Mancini Vincent C | $188,000 | Chicago Title Insurance Co |
Source: Public Records
Mortgage History
| Date | Status | Borrower | Loan Amount |
|---|---|---|---|
| Closed | Vanderwal Charles | $25,200 | |
| Previous Owner | Mancini Vincent C | $149,800 | |
| Closed | Mancini Vincent C | $12,500 | |
| Closed | Vanderwal Charles | $201,600 |
Source: Public Records
Tax History Compared to Growth
Tax History
| Year | Tax Paid | Tax Assessment Tax Assessment Total Assessment is a certain percentage of the fair market value that is determined by local assessors to be the total taxable value of land and additions on the property. | Land | Improvement |
|---|---|---|---|---|
| 2024 | $7,245 | $102,777 | $16,748 | $86,029 |
| 2023 | $7,049 | $93,281 | $15,201 | $78,080 |
| 2022 | $6,278 | $80,848 | $14,207 | $66,641 |
| 2021 | $6,091 | $76,677 | $13,474 | $63,203 |
| 2020 | $6,050 | $75,203 | $13,215 | $61,988 |
| 2019 | $6,048 | $72,541 | $12,747 | $59,794 |
| 2018 | $5,996 | $69,777 | $12,261 | $57,516 |
| 2017 | $5,966 | $67,476 | $11,857 | $55,619 |
| 2016 | $5,933 | $65,511 | $11,512 | $53,999 |
| 2015 | -- | $63,619 | $11,250 | $52,369 |
| 2014 | -- | $61,617 | $10,896 | $50,721 |
| 2013 | -- | $60,414 | $10,683 | $49,731 |
Source: Public Records
Map
Nearby Homes
- 1432 Hartsburg Ln Unit 1
- 1703 Breton Ave
- 413 Messenger Cir
- 1655 Patterson Ave
- 1663 Patterson Ave
- 1759 Breton Ave
- 867 Fair Meadow Ct
- 875 Fair Meadow Ct
- 1679 Patterson Ave
- 909 Fair Meadow St
- 917 Fair Meadow St
- Maxfield Plan at Autumn Ridge
- Morgan Plan at Autumn Ridge
- Newbury Plan at Autumn Ridge
- Quinn Plan at Autumn Ridge
- Paxton Plan at Autumn Ridge
- Leyden Plan at Autumn Ridge
- 1799 Breton Ave
- 868 Fair Meadow Ct
- 876 Fair Meadow Ct
- 941 Wilkinson Ln
- 957 Wilkinson Ln
- 965 Wilkinson Ln Unit 1
- 933 Wilkinson Ln
- 1474 Carlson Ct
- 1466 Carlson Ct
- 950 Wilkinson Ln
- 925 Wilkinson Ln
- 973 Wilkinson Ln
- 1471 Carlson Ct
- 958 Wilkinson Ln Unit 1
- 924 White Oak Dr
- 1458 Carlson Ct
- 966 Wilkinson Ln
- 917 Wilkinson Ln
- 981 Wilkinson Ln
- 942 Wilkinson Ln
- 909 Wilkinson Ln
- 916 White Oak Dr
- 974 Wilkinson Ln