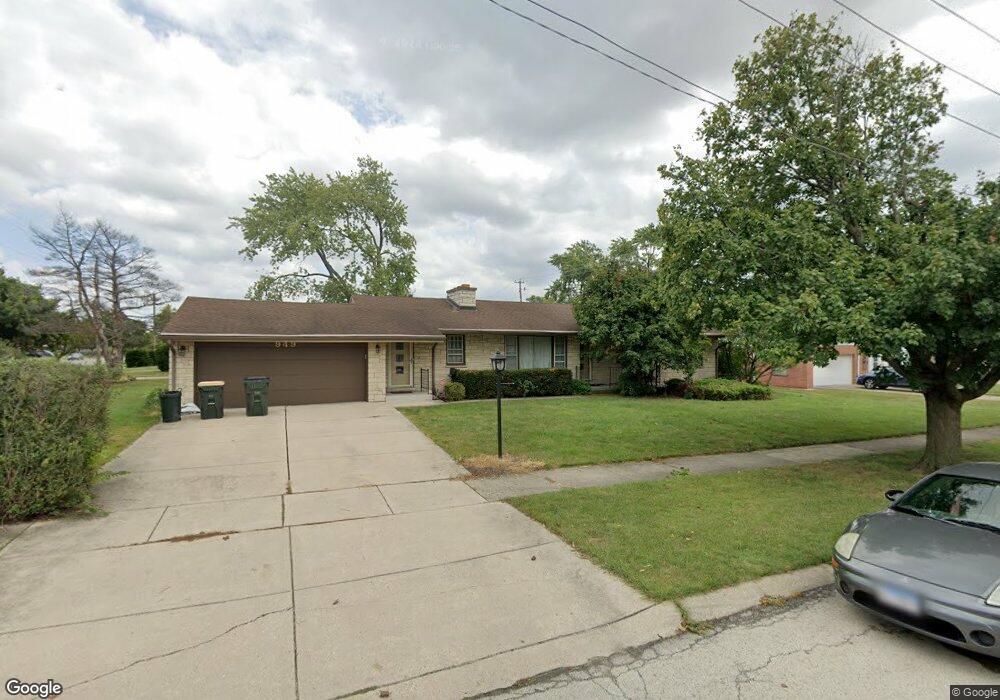
949 Wilkinson Pkwy Park Ridge, IL 60068
Estimated Value: $508,000 - $583,103
3
Beds
2
Baths
1,500
Sq Ft
$370/Sq Ft
Est. Value
About This Home
This home is located at 949 Wilkinson Pkwy, Park Ridge, IL 60068 and is currently estimated at $555,026, approximately $370 per square foot. 949 Wilkinson Pkwy is a home located in Cook County with nearby schools including Franklin Elementary School, Emerson Middle School, and Maine South High School.
Ownership History
Date
Name
Owned For
Owner Type
Purchase Details
Closed on
Aug 24, 2017
Sold by
Chicago Title Land Trust Co
Bought by
Lantin Chester and Lantin Madeleine
Current Estimated Value
Home Financials for this Owner
Home Financials are based on the most recent Mortgage that was taken out on this home.
Original Mortgage
$310,400
Outstanding Balance
$260,115
Interest Rate
4.12%
Mortgage Type
New Conventional
Estimated Equity
$294,911
Purchase Details
Closed on
Aug 24, 2007
Sold by
Kenyeri Lillian T
Bought by
The Chicago Trust Co and Trust #8002348805
Purchase Details
Closed on
Jan 5, 2006
Sold by
Tapling Edward G and Tapling Gloria J
Bought by
Kenyeri Lillian T
Purchase Details
Closed on
Dec 19, 1996
Sold by
Tapling Edward G and Tapling Gloria J
Bought by
Tapling Edward G and Tapling Gloria J
Create a Home Valuation Report for This Property
The Home Valuation Report is an in-depth analysis detailing your home's value as well as a comparison with similar homes in the area
Home Values in the Area
Average Home Value in this Area
Purchase History
| Date | Buyer | Sale Price | Title Company |
|---|---|---|---|
| Lantin Chester | $320,000 | Chicago Title | |
| The Chicago Trust Co | -- | None Available | |
| Kenyeri Lillian T | $425,000 | Prairie Title Inc | |
| Tapling Edward G | -- | -- |
Source: Public Records
Mortgage History
| Date | Status | Borrower | Loan Amount |
|---|---|---|---|
| Open | Lantin Chester | $310,400 |
Source: Public Records
Tax History Compared to Growth
Tax History
| Year | Tax Paid | Tax Assessment Tax Assessment Total Assessment is a certain percentage of the fair market value that is determined by local assessors to be the total taxable value of land and additions on the property. | Land | Improvement |
|---|---|---|---|---|
| 2024 | $10,818 | $43,176 | $13,884 | $29,292 |
| 2023 | $11,963 | $46,000 | $13,884 | $32,116 |
| 2022 | $11,963 | $46,000 | $13,884 | $32,116 |
| 2021 | $8,886 | $29,215 | $9,078 | $20,137 |
| 2020 | $8,533 | $29,215 | $9,078 | $20,137 |
| 2019 | $8,461 | $32,462 | $9,078 | $23,384 |
| 2018 | $7,713 | $26,954 | $8,010 | $18,944 |
| 2017 | $9,373 | $32,894 | $8,010 | $24,884 |
| 2016 | $9,025 | $32,894 | $8,010 | $24,884 |
| 2015 | $7,509 | $24,347 | $6,942 | $17,405 |
| 2014 | $8,962 | $29,642 | $6,942 | $22,700 |
| 2013 | $8,489 | $29,642 | $6,942 | $22,700 |
Source: Public Records
Map
Nearby Homes
- 1717 Oakton St
- 907 Wilkinson Pkwy
- 863 N Northwest Hwy
- 1815 Oakton St Unit 2A
- 1420 Oakton St
- 1720 Greendale Ave
- 776 N Northwest Hwy
- 900 Rowe Ave
- 819 Busse Hwy
- 1044 N Knight Ave
- 1025 N Knight Ave
- 1712 Woodland Ave
- 751 N Northwest Hwy
- 911 Busse Hwy Unit 302
- 1039 N Northwest Hwy Unit A5
- 2200 Bouterse St Unit 409B
- 2200 Bouterse St Unit 407
- 1819 Glenview Ave
- 716 N Western Ave
- 722 N Northwest Hwy Unit A
- 1623 Oakton St
- 1623 Oakton St
- 941 Wilkinson Pkwy
- 1675 Oakton St
- 1617 Oakton St
- 939 Wilkinson Pkwy
- 950 Wilkinson Pkwy
- 950 Wilkinson Pkwy
- 1607 Oakton St
- 1717 Oakton St
- 933 Wilkinson Pkwy
- 940 Wilkinson Pkwy
- 1721 Oakton St
- 1721 Oakton St
- 926 Tomawadee Dr
- 1704 Oakton St
- 1704 Oakton St
- 1700 Oakton St
- 1605 Oakton St
- 936 Wilkinson Pkwy