9495 S Stoney Creek Rd Carleton, MI 48117
Estimated Value: $312,792 - $497,000
Studio
1
Bath
1,539
Sq Ft
$239/Sq Ft
Est. Value
About This Home
This home is located at 9495 S Stoney Creek Rd, Carleton, MI 48117 and is currently estimated at $367,948, approximately $239 per square foot. 9495 S Stoney Creek Rd is a home located in Monroe County with nearby schools including Airport Senior High School, St. Patrick Elementary School, and Holy Ghost Lutheran School.
Ownership History
Date
Name
Owned For
Owner Type
Purchase Details
Closed on
Aug 26, 2021
Sold by
Angel Christopher James
Bought by
Angel Christopher James and Angel Brooke Marie
Current Estimated Value
Purchase Details
Closed on
Feb 5, 2019
Sold by
Angel Christopher J
Bought by
Angel Christopher J
Home Financials for this Owner
Home Financials are based on the most recent Mortgage that was taken out on this home.
Original Mortgage
$100,001
Outstanding Balance
$87,746
Interest Rate
4.6%
Mortgage Type
New Conventional
Estimated Equity
$280,202
Create a Home Valuation Report for This Property
The Home Valuation Report is an in-depth analysis detailing your home's value as well as a comparison with similar homes in the area
Home Values in the Area
Average Home Value in this Area
Purchase History
| Date | Buyer | Sale Price | Title Company |
|---|---|---|---|
| Angel Christopher James | -- | None Available | |
| Angel Christopher J | -- | New Title Company Name |
Source: Public Records
Mortgage History
| Date | Status | Borrower | Loan Amount |
|---|---|---|---|
| Open | Angel Christopher J | $100,001 |
Source: Public Records
Tax History
| Year | Tax Paid | Tax Assessment Tax Assessment Total Assessment is a certain percentage of the fair market value that is determined by local assessors to be the total taxable value of land and additions on the property. | Land | Improvement |
|---|---|---|---|---|
| 2025 | $1,222 | $147,500 | $23,100 | $124,400 |
| 2024 | $1,185 | $142,600 | $0 | $0 |
| 2023 | $1,129 | $121,500 | $0 | $0 |
| 2022 | $2,451 | $121,500 | $0 | $0 |
| 2021 | $2,362 | $119,500 | $0 | $0 |
| 2020 | $2,333 | $107,600 | $0 | $0 |
| 2019 | $2,285 | $107,600 | $0 | $0 |
| 2018 | $2,232 | $103,000 | $0 | $0 |
| 2017 | $2,103 | $95,100 | $0 | $0 |
| 2016 | $2,079 | $95,100 | $0 | $0 |
| 2015 | $1,998 | $87,200 | $0 | $0 |
| 2014 | $1,973 | $87,200 | $0 | $0 |
| 2013 | -- | $84,600 | $0 | $0 |
Source: Public Records
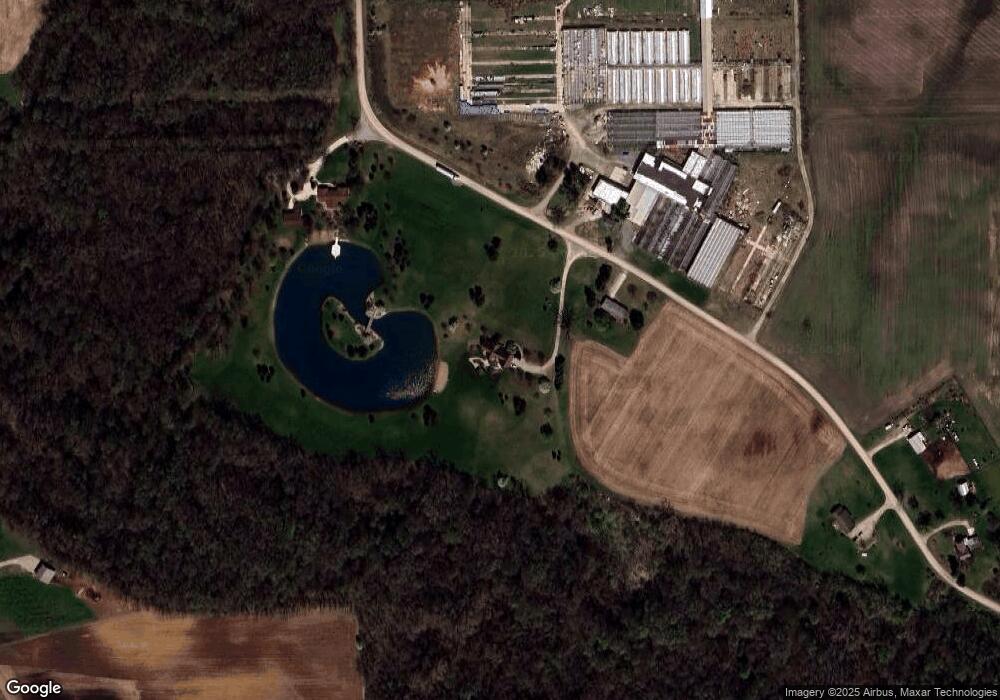
Map
Nearby Homes
- 9601 Exeter Rd
- 8485 S Stoney Creek Rd
- 49 James Dr
- 3290 Gruber Rd
- 8705 Steffas Rd
- 0 N Telegraph Rd Unit 50189310
- 12259 Eldora St
- 1405 Cedarcrest Dr
- 0 N Telegraph Rd
- 0 N Telegraph Rd Unit 50165571
- 0 N Telegraph Rd Unit 25053939
- 0000 Telegraph Rd
- 12464 Maxwell Rd
- 12361 Spencer Ln
- 5571 Zink Rd
- 4011 Bluebush Rd
- 1827 Newport Rd
- 3186 Bluebush Rd
- 1969 Lasalle Rd
- 1855 Laurel St
- 10244 N Stoney Creek Rd
- 9829 N Stoney Creek Rd Unit S
- 0000 S Stony Creek
- 9455 S Stoney Creek Rd
- 9827 N Stoney Creek Rd
- 000 S Stony Creek
- 9468 S Stoney Creek Rd
- 9456 S Stony Creek Rd
- 9433 S Stoney Creek Rd
- 9530 S Stoney Creek Rd
- 9825 N Stoney Creek Rd
- 9456 S Stoney Creek Rd
- 9831 N Stoney Creek Rd
- 9444 S Stoney Creek Rd
- 9401 S Stoney Creek Rd
- 9828 N Stoney Creek Rd
- 9803 N Stoney Creek Rd
- 9773 N Stoney Creek Rd
- 9770 N Stoney Creek Rd
- 9606 S Stony Creek Rd
Your Personal Tour Guide
Ask me questions while you tour the home.