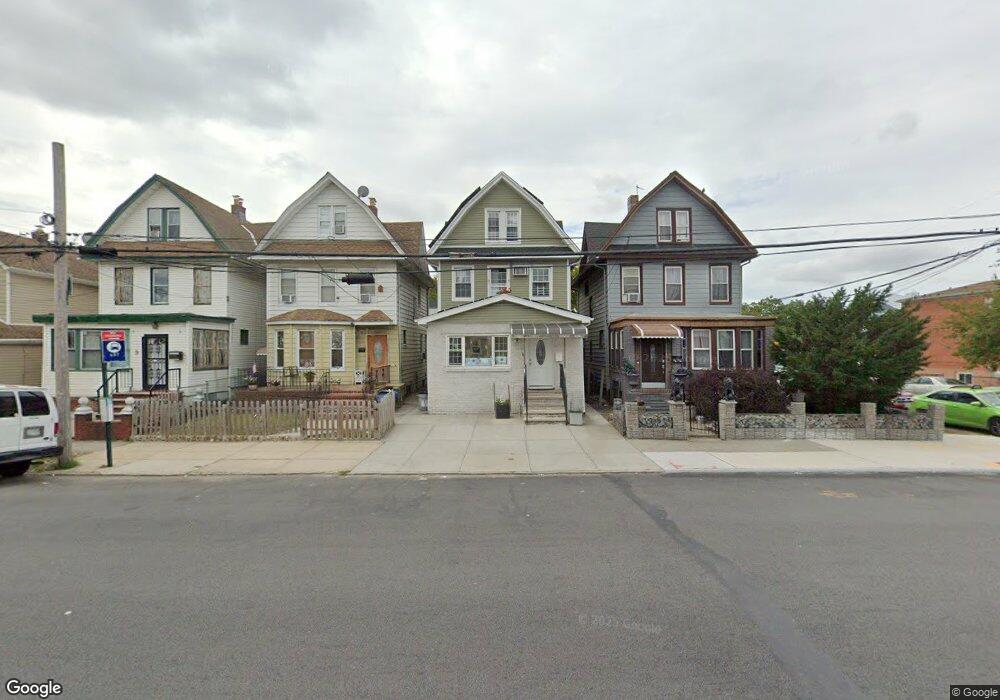
95-04 111th St Unit 2 South Richmond Hill, NY 11419
Richmond Hill NeighborhoodEstimated Value: $616,000 - $881,000
3
Beds
1
Bath
1,564
Sq Ft
$502/Sq Ft
Est. Value
About This Home
This home is located at 95-04 111th St Unit 2, South Richmond Hill, NY 11419 and is currently estimated at $785,447, approximately $502 per square foot. 95-04 111th St Unit 2 is a home located in Queens County with nearby schools including P.S. 62 - Chester Park, M.S.137 America's School of Heroes, and Richmond Hill High School.
Ownership History
Date
Name
Owned For
Owner Type
Purchase Details
Closed on
Feb 5, 2019
Sold by
107-55 Merrick Blvd Realty Inc
Bought by
Bermeo Buri Wilson O and Marquez Gomez Ana L
Current Estimated Value
Home Financials for this Owner
Home Financials are based on the most recent Mortgage that was taken out on this home.
Original Mortgage
$656,287
Outstanding Balance
$575,817
Interest Rate
4.4%
Mortgage Type
Purchase Money Mortgage
Estimated Equity
$209,630
Purchase Details
Closed on
Mar 23, 2017
Sold by
Dye Esq Luther V
Bought by
10755 Merrick Blvd Realty Inc
Purchase Details
Closed on
Aug 29, 2001
Sold by
Frank Lucienne and Douglas Joel
Bought by
Douglas Ruby and Seifforth Sharon
Home Financials for this Owner
Home Financials are based on the most recent Mortgage that was taken out on this home.
Original Mortgage
$243,000
Interest Rate
6.92%
Purchase Details
Closed on
Aug 20, 1996
Sold by
Spring Equities Inc
Bought by
Douglas Joel A and Douglas Renison A
Home Financials for this Owner
Home Financials are based on the most recent Mortgage that was taken out on this home.
Original Mortgage
$201,300
Interest Rate
8.26%
Mortgage Type
FHA
Create a Home Valuation Report for This Property
The Home Valuation Report is an in-depth analysis detailing your home's value as well as a comparison with similar homes in the area
Home Values in the Area
Average Home Value in this Area
Purchase History
| Date | Buyer | Sale Price | Title Company |
|---|---|---|---|
| Bermeo Buri Wilson O | $750,000 | -- | |
| 10755 Merrick Blvd Realty Inc | $390,000 | -- | |
| Douglas Ruby | -- | -- | |
| Douglas Joel A | $205,000 | -- |
Source: Public Records
Mortgage History
| Date | Status | Borrower | Loan Amount |
|---|---|---|---|
| Open | Bermeo Buri Wilson O | $656,287 | |
| Previous Owner | Douglas Ruby | $243,000 | |
| Previous Owner | Douglas Joel A | $201,300 |
Source: Public Records
Tax History Compared to Growth
Tax History
| Year | Tax Paid | Tax Assessment Tax Assessment Total Assessment is a certain percentage of the fair market value that is determined by local assessors to be the total taxable value of land and additions on the property. | Land | Improvement |
|---|---|---|---|---|
| 2025 | $6,423 | $33,898 | $10,370 | $23,528 |
| 2024 | $4,997 | $31,979 | $10,674 | $21,305 |
| 2023 | $6,060 | $30,172 | $10,344 | $19,828 |
| 2022 | $4,257 | $43,500 | $15,180 | $28,320 |
| 2021 | $5,990 | $36,060 | $15,180 | $20,880 |
| 2020 | $5,979 | $36,720 | $15,180 | $21,540 |
| 2019 | $4,226 | $33,660 | $15,180 | $18,480 |
| 2018 | $5,125 | $25,143 | $11,693 | $13,450 |
| 2017 | $4,835 | $23,720 | $11,630 | $12,090 |
| 2016 | $4,742 | $23,720 | $11,630 | $12,090 |
| 2015 | $2,699 | $23,540 | $15,241 | $8,299 |
| 2014 | $2,699 | $22,208 | $14,379 | $7,829 |
Source: Public Records
Map
Nearby Homes
- 95-04 111th St
- 95-04 111th St Unit 2nd Fl
- 95-08 111th St
- 9504 111th St
- 9502 111th St
- 9506 111th St
- 9508 111th St
- 9510 111th St
- 11008 95th Ave
- 11008 95th Ave
- 9512 111th St
- 9450 111th St
- 11102 95th Ave
- 11006 95th Ave
- 110-06 95th Ave
- 9514 111th St
- 110-08 95th Ave
- 9448 111th St
- 11104 95th Ave
- 9516 111th St