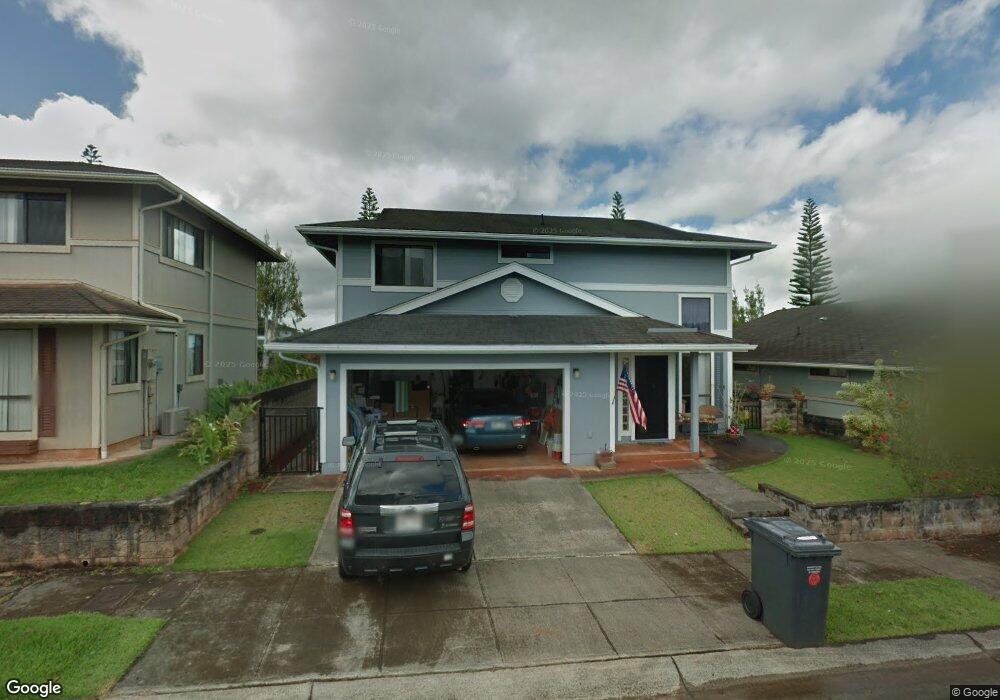
95-1105 Halekua St Unit 64 Mililani, HI 96789
Estimated Value: $1,046,189 - $1,190,000
3
Beds
3
Baths
1,356
Sq Ft
$803/Sq Ft
Est. Value
About This Home
This home is located at 95-1105 Halekua St Unit 64, Mililani, HI 96789 and is currently estimated at $1,089,047, approximately $803 per square foot. 95-1105 Halekua St Unit 64 is a home located in Honolulu County with nearby schools including Mililani Ike Elementary School, Mililani Middle School, and Mililani High School.
Ownership History
Date
Name
Owned For
Owner Type
Purchase Details
Closed on
Oct 16, 2018
Sold by
Kawatachi Arthur Seikichi and Kawatachi Kay Natsue
Bought by
Kawatachi Arthur S and Kawatachi Kay N
Current Estimated Value
Purchase Details
Closed on
Aug 28, 2003
Sold by
Miller Alan Takeshi and Miller Kathy Yim Mui
Bought by
Kawatachi Arthur Seikichi and Kawatachi Kay Natsue
Home Financials for this Owner
Home Financials are based on the most recent Mortgage that was taken out on this home.
Original Mortgage
$279,000
Outstanding Balance
$126,126
Interest Rate
5.87%
Mortgage Type
Unknown
Estimated Equity
$962,921
Purchase Details
Closed on
Jul 19, 1999
Sold by
Castle & Cooke Homes Hawaii Inc
Bought by
Miller Alan Takeshi and Miller Kathy Yim Mui
Home Financials for this Owner
Home Financials are based on the most recent Mortgage that was taken out on this home.
Original Mortgage
$160,000
Interest Rate
7.64%
Create a Home Valuation Report for This Property
The Home Valuation Report is an in-depth analysis detailing your home's value as well as a comparison with similar homes in the area
Home Values in the Area
Average Home Value in this Area
Purchase History
| Date | Buyer | Sale Price | Title Company |
|---|---|---|---|
| Kawatachi Arthur S | -- | None Available | |
| Kawatachi Arthur S | -- | None Available | |
| Kawatachi Arthur Seikichi | $379,000 | -- | |
| Miller Alan Takeshi | $260,000 | -- |
Source: Public Records
Mortgage History
| Date | Status | Borrower | Loan Amount |
|---|---|---|---|
| Open | Kawatachi Arthur Seikichi | $279,000 | |
| Previous Owner | Miller Alan Takeshi | $160,000 |
Source: Public Records
Tax History Compared to Growth
Tax History
| Year | Tax Paid | Tax Assessment Tax Assessment Total Assessment is a certain percentage of the fair market value that is determined by local assessors to be the total taxable value of land and additions on the property. | Land | Improvement |
|---|---|---|---|---|
| 2025 | $3,169 | $968,000 | $682,200 | $285,800 |
| 2024 | $3,169 | $905,300 | $627,100 | $278,200 |
| 2023 | $3,226 | $921,800 | $627,100 | $294,700 |
| 2022 | $3,099 | $885,400 | $585,700 | $299,700 |
| 2021 | $2,718 | $776,500 | $516,800 | $259,700 |
| 2020 | $2,607 | $744,800 | $496,100 | $248,700 |
| 2019 | $2,542 | $726,400 | $496,100 | $230,300 |
| 2018 | $2,483 | $709,500 | $482,400 | $227,100 |
| 2017 | $2,419 | $691,100 | $447,900 | $243,200 |
| 2016 | $2,287 | $653,400 | $413,500 | $239,900 |
| 2015 | $2,244 | $641,200 | $413,500 | $227,700 |
| 2014 | $1,796 | $591,600 | $344,500 | $247,100 |
Source: Public Records
Map
Nearby Homes
- 95-1054 Puuanu St Unit 5
- 95-1061 Kekahi St Unit 80
- 95-1029 Kuauli St Unit 95
- 95-1052 Hoalia St Unit 52
- 95-1017 Kuauli St Unit 123
- 95-1047 Kahakiki St
- 95-1047 Hololani St
- 95-1078 Kahakiki St
- 95-1298 Wikao St Unit 25
- 95-1063 Kaapeha St Unit 131
- 95-1067 Kaapeha St Unit 115
- 95-1168 Makaikai St Unit 111
- 95-1164 Makaikai St Unit 131
- 95-1164 Makaikai St Unit 128
- 95-1273 Wikao St Unit 60
- 95-1182 Makaikai St Unit 52
- 95-1161 Makaikai St Unit 196
- 95-1149 Makaikai St Unit 116
- 95-1151 Makaikai St Unit 108
- 95-1052 Mahea St
- 95-1103 Halekua St Unit 65
- 95-1111 Halekua St Unit 62
- 95-1109 Halekua St Unit 63
- 95-1099 Halekua St Unit 66
- 95-1007 Hoahui St Unit 18
- 95-1115 Halekua St Unit 61
- 95-1095 Halekua St Unit 67
- 95-225 Hoani Place Unit 45
- 95-219 Ahohui St Unit 24
- 95-218 Ahohui St Unit 32
- 95-1119 Halekua St Unit 60
- 95-228 Hoani Place Unit 58
- 95-200 Paehia Place
- 95-1093 Halekua St Unit 68
- 951118 Halekua St Unit 59
- 95-204 Paehia Place
- 95-217 Ahohui St Unit 23
- 95-1118 Halekua St Unit 59
- 95-201 Paehia Place
- 95-1094 Halekua St Unit 26