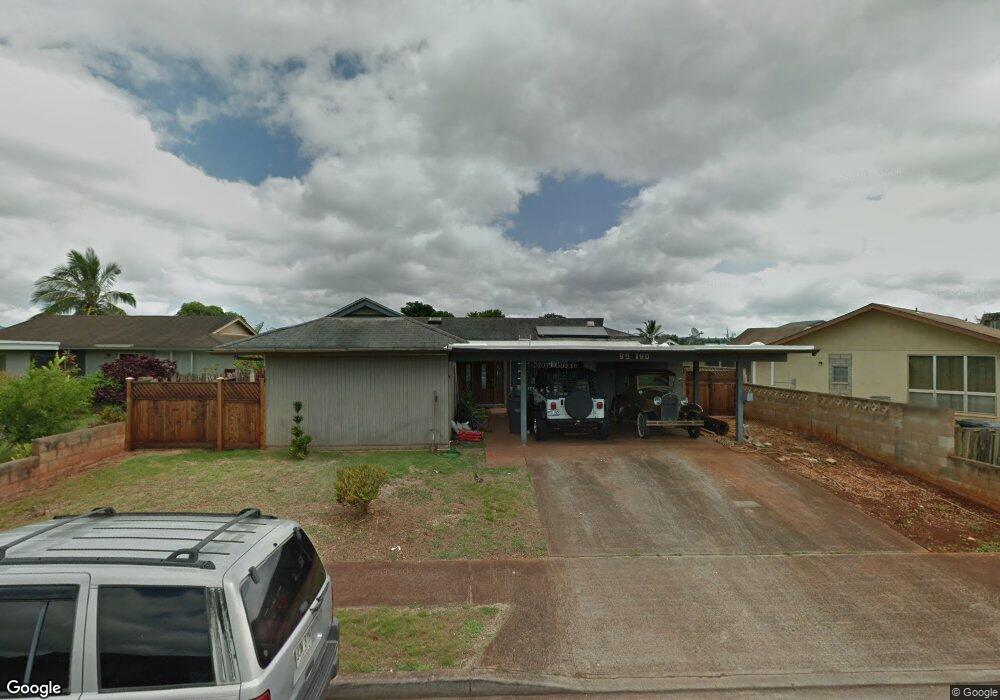
95-190 Kaopua Loop Mililani, HI 96789
Estimated Value: $1,039,661 - $1,152,000
3
Beds
2
Baths
1,276
Sq Ft
$846/Sq Ft
Est. Value
About This Home
This home is located at 95-190 Kaopua Loop, Mililani, HI 96789 and is currently estimated at $1,078,915, approximately $845 per square foot. 95-190 Kaopua Loop is a home located in Honolulu County with nearby schools including Mililani Waena Elementary School, Mililani Middle School, and Mililani High School.
Ownership History
Date
Name
Owned For
Owner Type
Purchase Details
Closed on
Jan 26, 2009
Sold by
Leeson Ammon Kershner and Leeson Deborah Lynn
Bought by
Tolentino Arthur Blaise and Tolentino Lori Mei Yung Kwock
Current Estimated Value
Home Financials for this Owner
Home Financials are based on the most recent Mortgage that was taken out on this home.
Original Mortgage
$396,000
Outstanding Balance
$250,855
Interest Rate
5.14%
Mortgage Type
Unknown
Estimated Equity
$828,060
Purchase Details
Closed on
Jun 14, 2005
Sold by
Shin Sang Pil and Shin Hyo Jung
Bought by
Leeson Ammon Kershner and Leeson Deborah Lynn
Home Financials for this Owner
Home Financials are based on the most recent Mortgage that was taken out on this home.
Original Mortgage
$506,170
Interest Rate
5.72%
Mortgage Type
VA
Create a Home Valuation Report for This Property
The Home Valuation Report is an in-depth analysis detailing your home's value as well as a comparison with similar homes in the area
Home Values in the Area
Average Home Value in this Area
Purchase History
| Date | Buyer | Sale Price | Title Company |
|---|---|---|---|
| Tolentino Arthur Blaise | $440,000 | Tg | |
| Leeson Ammon Kershner | $490,000 | Tg |
Source: Public Records
Mortgage History
| Date | Status | Borrower | Loan Amount |
|---|---|---|---|
| Open | Tolentino Arthur Blaise | $396,000 | |
| Previous Owner | Leeson Ammon Kershner | $506,170 |
Source: Public Records
Tax History Compared to Growth
Tax History
| Year | Tax Paid | Tax Assessment Tax Assessment Total Assessment is a certain percentage of the fair market value that is determined by local assessors to be the total taxable value of land and additions on the property. | Land | Improvement |
|---|---|---|---|---|
| 2025 | $2,998 | $1,000,700 | $840,000 | $160,700 |
| 2024 | $2,998 | $976,700 | $840,000 | $136,700 |
| 2023 | $2,708 | $973,700 | $819,000 | $154,700 |
| 2022 | $2,956 | $944,600 | $703,500 | $241,100 |
| 2021 | $2,317 | $762,100 | $598,500 | $163,600 |
| 2020 | $2,385 | $781,400 | $577,500 | $203,900 |
| 2019 | $2,437 | $776,400 | $577,500 | $198,900 |
| 2018 | $2,035 | $661,500 | $451,500 | $210,000 |
| 2017 | $1,972 | $643,500 | $451,500 | $192,000 |
| 2016 | $1,937 | $633,300 | $451,500 | $181,800 |
| 2015 | $1,972 | $643,300 | $441,000 | $202,300 |
| 2014 | -- | $579,500 | $399,000 | $180,500 |
Source: Public Records
Map
Nearby Homes
- 95-142 Kuahelani Ave Unit 251
- 95-142 Kuahelani Ave Unit 127
- 95-138 Kuahelani Ave Unit 244
- 95-322 Kaloapau St Unit 128
- 95-29 Kuahelani Ave Unit 226
- 94-029 Hokupalemo Place
- 95-337 Pohina Place
- 95-364 Waia Loop
- 94-354 Keaolani St
- 94-048 Hokupalemo St
- 95-436 Opo Place
- 95-322 Kahikinui Ct Unit 233
- 95-312 Kahikinui Ct Unit 213
- 94-555 Alapoai St Unit 152
- 94-557 Alapoai St Unit 154
- 95-400 Hokukea Ct Unit 251
- 95-400 Hokukea Ct Unit 250
- 94-70 Akualele Place
- 95-380 Hokukea Ct Unit 241
- 95-092 Waipuka St
- 95-186 Kaopua Loop
- 95-194 Kaopua Loop
- 95-210 Hokulea Place
- 95-208 Hokulea Place
- 95-182 Kaopua Loop
- 95-204 Kaopua Loop
- 95-191 Kaopua Loop
- 95-209 Hokulea Place
- 95-187 Kaopua Loop
- 95-212 Kaopua Loop
- 95-180 Kaopua Loop
- 95-183 Kaopua Loop
- 95-195 Kaopua Loop
- 95-206 Hokulea Place
- 95-216 Kaopua Loop
- 95-207 Hokulea Place
- 95-178 Kaopua Loop
- 95-177 Kaopua Loop
- 95-199 Kaopua Loop
- 95-203 Kaopua Loop