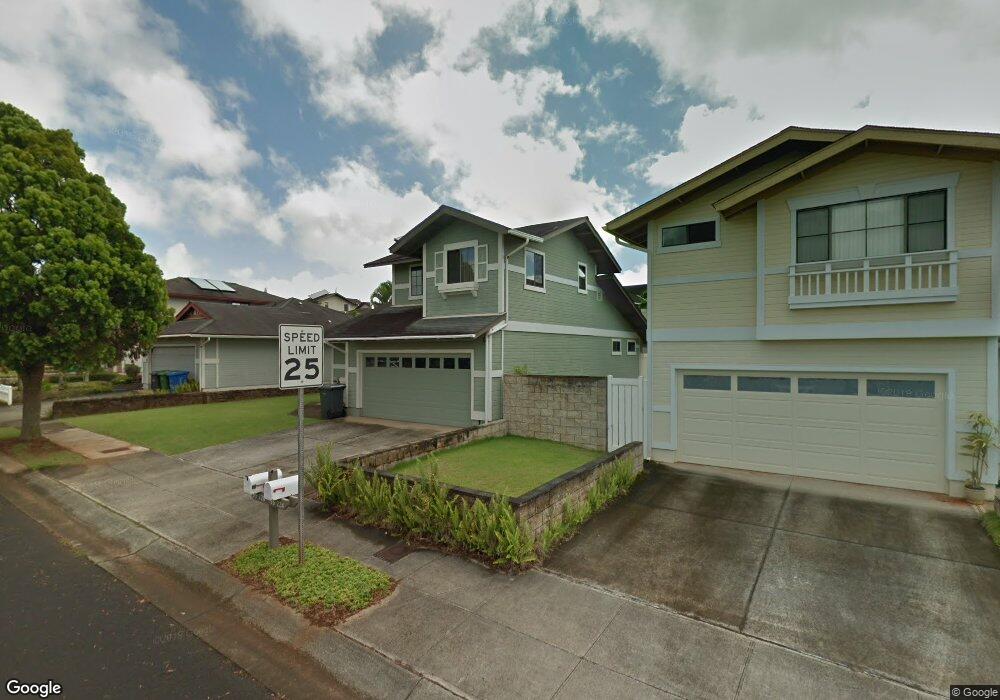
95-220 Ahunalii Place Mililani, HI 96789
Estimated Value: $1,019,244 - $1,226,000
3
Beds
2
Baths
1,312
Sq Ft
$841/Sq Ft
Est. Value
About This Home
This home is located at 95-220 Ahunalii Place, Mililani, HI 96789 and is currently estimated at $1,103,811, approximately $841 per square foot. 95-220 Ahunalii Place is a home located in Honolulu County with nearby schools including Mililani Ike Elementary School, Mililani Middle School, and Mililani High School.
Ownership History
Date
Name
Owned For
Owner Type
Purchase Details
Closed on
Aug 24, 2012
Sold by
Francisco David Dean Kanoa and Francisco Lori Ann Emiko
Bought by
Francisco David D K and Francisco Lori Ann E
Current Estimated Value
Purchase Details
Closed on
Apr 12, 2007
Sold by
Knox James Alan and Knox Susan Audrey
Bought by
Francisco David Dean Kanoa and Francisco Lori Ann Emiko
Home Financials for this Owner
Home Financials are based on the most recent Mortgage that was taken out on this home.
Original Mortgage
$495,200
Outstanding Balance
$298,587
Interest Rate
6.1%
Mortgage Type
Unknown
Estimated Equity
$805,224
Purchase Details
Closed on
Dec 22, 1997
Sold by
Castle & Cooke Homes Hawaii Inc
Bought by
Knox James Alan and Knox Susan Audrey
Home Financials for this Owner
Home Financials are based on the most recent Mortgage that was taken out on this home.
Original Mortgage
$234,650
Interest Rate
7.16%
Mortgage Type
Purchase Money Mortgage
Create a Home Valuation Report for This Property
The Home Valuation Report is an in-depth analysis detailing your home's value as well as a comparison with similar homes in the area
Home Values in the Area
Average Home Value in this Area
Purchase History
| Date | Buyer | Sale Price | Title Company |
|---|---|---|---|
| Francisco David D K | -- | None Available | |
| Francisco David D K | -- | None Available | |
| Francisco David Dean Kanoa | $619,000 | Fam | |
| Knox James Alan | $247,500 | -- |
Source: Public Records
Mortgage History
| Date | Status | Borrower | Loan Amount |
|---|---|---|---|
| Open | Francisco David Dean Kanoa | $495,200 | |
| Previous Owner | Knox James Alan | $234,650 |
Source: Public Records
Tax History Compared to Growth
Tax History
| Year | Tax Paid | Tax Assessment Tax Assessment Total Assessment is a certain percentage of the fair market value that is determined by local assessors to be the total taxable value of land and additions on the property. | Land | Improvement |
|---|---|---|---|---|
| 2025 | $2,752 | $941,100 | $725,600 | $215,500 |
| 2024 | $2,752 | $906,200 | $689,300 | $216,900 |
| 2023 | $3,117 | $990,700 | $725,600 | $265,100 |
| 2022 | $2,899 | $928,200 | $634,900 | $293,300 |
| 2021 | $2,315 | $761,400 | $544,200 | $217,200 |
| 2020 | $2,377 | $779,100 | $544,200 | $234,900 |
| 2019 | $2,386 | $761,700 | $544,200 | $217,500 |
| 2018 | $2,275 | $730,100 | $507,900 | $222,200 |
| 2017 | $2,136 | $690,400 | $444,400 | $246,000 |
| 2016 | $1,934 | $632,700 | $408,100 | $224,600 |
| 2015 | $1,917 | $627,800 | $399,100 | $228,700 |
| 2014 | -- | $591,100 | $362,800 | $228,300 |
Source: Public Records
Map
Nearby Homes
- 95-1054 Puuanu St Unit 5
- 95-1061 Kekahi St Unit 80
- 95-1029 Kuauli St Unit 95
- 95-1052 Hoalia St Unit 52
- 95-1017 Kuauli St Unit 123
- 95-1047 Kahakiki St
- 95-1078 Kahakiki St
- 95-1063 Kaapeha St Unit 131
- 95-1047 Hololani St
- 95-1067 Kaapeha St Unit 115
- 95-1168 Makaikai St Unit 111
- 95-1164 Makaikai St Unit 131
- 95-1164 Makaikai St Unit 128
- 95-1182 Makaikai St Unit 52
- 95-1161 Makaikai St Unit 196
- 95-1149 Makaikai St Unit 116
- 95-1151 Makaikai St Unit 108
- 95-1298 Wikao St Unit 25
- 95-1052 Mahea St
- 95-1273 Wikao St Unit 60
- 95-218 Ahunalii Place
- 95-224 Ahunalii Place
- 95-221 Paehia Place
- 95-214 Ahunalii Place
- 95-217 Paehia Place
- 95-225 Paehia Place
- 95-221 Ahunalii Place
- 95-213 Paehia Place
- 95-217 Ahunalii Place
- 95-225 Ahunalii Place
- 95-210 Ahunalii Place
- 95-213 Ahunalii Place
- 95-211 Paehia Place
- 95-1022 Puuanu St Unit 105
- 95-208 Ahunalii Place
- 95-1028 Puuanu St Unit 108
- 95-211 Ahunalii Place
- 95-1020 Puuanu St Unit 104
- 95-220 Paehia Place
- 95-207 Paehia Place