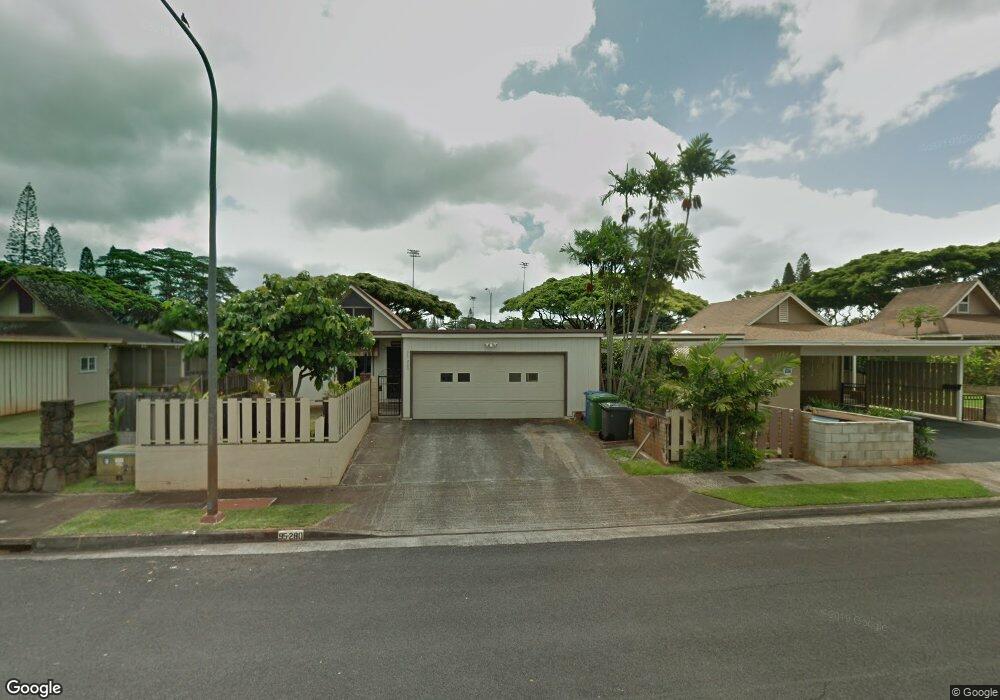
95-280 Kailiula Loop Mililani, HI 96789
Estimated Value: $961,000 - $1,134,000
3
Beds
2
Baths
1,468
Sq Ft
$725/Sq Ft
Est. Value
About This Home
This home is located at 95-280 Kailiula Loop, Mililani, HI 96789 and is currently estimated at $1,064,477, approximately $725 per square foot. 95-280 Kailiula Loop is a home located in Honolulu County with nearby schools including Mililani Waena Elementary School, Mililani Middle School, and Mililani High School.
Ownership History
Date
Name
Owned For
Owner Type
Purchase Details
Closed on
Apr 13, 2009
Sold by
Lo Jones and Lo Eunice Chung Fong
Bought by
Hindman Jerry Linn
Current Estimated Value
Home Financials for this Owner
Home Financials are based on the most recent Mortgage that was taken out on this home.
Original Mortgage
$476,215
Outstanding Balance
$304,743
Interest Rate
5.17%
Mortgage Type
FHA
Estimated Equity
$759,734
Purchase Details
Closed on
Oct 24, 2003
Sold by
Jim Flora Torres and Cohen Winifred P
Bought by
Lo Jones and Lo Eunice Chung Fong
Home Financials for this Owner
Home Financials are based on the most recent Mortgage that was taken out on this home.
Original Mortgage
$210,000
Interest Rate
5.94%
Mortgage Type
Unknown
Purchase Details
Closed on
Jun 21, 2002
Sold by
Cohen Winifred Puanani
Bought by
Cohen Winifred P and The Jim Family Irrevocable Trust
Purchase Details
Closed on
Jun 7, 2002
Sold by
Jim Flora T
Bought by
Jim Flora Torres
Purchase Details
Closed on
Sep 12, 2000
Sold by
Jim Richard Bailey and Jim Flora Torres
Bought by
Jim Flora T and The Richard B Jim Trust
Create a Home Valuation Report for This Property
The Home Valuation Report is an in-depth analysis detailing your home's value as well as a comparison with similar homes in the area
Home Values in the Area
Average Home Value in this Area
Purchase History
| Date | Buyer | Sale Price | Title Company |
|---|---|---|---|
| Hindman Jerry Linn | $485,000 | Fam | |
| Lo Jones | $330,000 | -- | |
| Cohen Winifred P | -- | -- | |
| Jim Richard Bailey | -- | -- | |
| Jim Flora Torres | -- | -- | |
| Jim Flora T | -- | -- |
Source: Public Records
Mortgage History
| Date | Status | Borrower | Loan Amount |
|---|---|---|---|
| Open | Hindman Jerry Linn | $476,215 | |
| Previous Owner | Lo Jones | $210,000 |
Source: Public Records
Tax History Compared to Growth
Tax History
| Year | Tax Paid | Tax Assessment Tax Assessment Total Assessment is a certain percentage of the fair market value that is determined by local assessors to be the total taxable value of land and additions on the property. | Land | Improvement |
|---|---|---|---|---|
| 2025 | $3,396 | $943,200 | $798,400 | $144,800 |
| 2024 | $3,396 | $970,200 | $798,400 | $171,800 |
| 2023 | $4,426 | $1,037,400 | $778,400 | $259,000 |
| 2022 | $3,267 | $933,500 | $668,600 | $264,900 |
| 2021 | $2,598 | $742,300 | $568,800 | $173,500 |
| 2020 | $2,727 | $779,100 | $548,900 | $230,200 |
| 2019 | $2,627 | $750,600 | $548,900 | $201,700 |
| 2018 | $4,840 | $691,400 | $429,100 | $262,300 |
| 2017 | $2,319 | $662,700 | $429,100 | $233,600 |
| 2016 | $1,967 | $562,100 | $429,100 | $133,000 |
| 2015 | $2,024 | $578,200 | $419,200 | $159,000 |
| 2014 | -- | $536,200 | $379,200 | $157,000 |
Source: Public Records
Map
Nearby Homes
- 95-364 Waia Loop
- 95-337 Pohina Place
- 95-017 Kuahelani Ave Unit 221
- 95-322 Kahikinui Ct Unit 233
- 95-29 Kuahelani Ave Unit 226
- 95-312 Kahikinui Ct Unit 213
- 94-029 Hokupalemo Place
- 95-400 Hokukea Ct Unit 251
- 95-380 Hokukea Ct Unit 241
- 94-048 Hokupalemo St
- 94-063 Anania Dr Unit 123
- 94-059 Anania Dr Unit 120
- 94-70 Akualele Place
- 94-1069 Anania Cir Unit 16
- 94-1010 Anania Cir Unit 85
- 95-1029 Wekiu St
- 95-150 Kuahelani Ave Unit 256
- 95-142 Kuahelani Ave Unit 251
- 95-142 Kuahelani Ave Unit 127
- 95-138 Kuahelani Ave Unit 244
- 95-282 Kailiula Loop
- 95-236 Kailiula Place
- 95-288 Kailiula Loop
- 95-234 Kailiula Place
- 95-276 Kailiula Loop
- 95-277 Kailiula Loop
- 95-292 Kailiula Loop
- 95-230 Kailiula Place
- 95-304 Hakupokano Loop
- 95-272 Kailiula Loop
- 95-273 Kailiula Loop
- 95-295 Kailiula Loop
- 95-308 Hakupokano Loop
- 95-299 Kailiula Loop
- 95-294 Kailiula Loop
- 95-268 Kailiula Loop
- 95-269 Kailiula Loop
- 95-312 Hakupokano Loop
- 95-303 Kailiula Loop
- 95-298 Hakupokano Loop