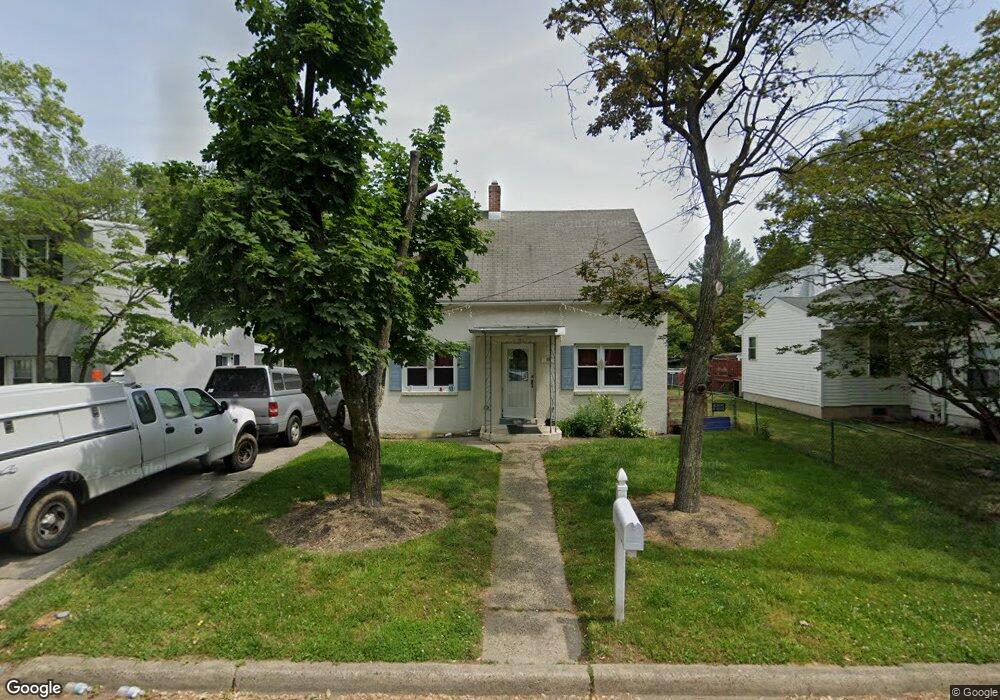
95 6th Ave Penns Grove, NJ 08069
Estimated Value: $178,000 - $279,000
3
Beds
2
Baths
1,332
Sq Ft
$182/Sq Ft
Est. Value
About This Home
This home is located at 95 6th Ave, Penns Grove, NJ 08069 and is currently estimated at $242,658, approximately $182 per square foot. 95 6th Ave is a home located in Salem County with nearby schools including Lafayette-Pershing Elementary School, Field Street Elementary School, and Paul W. Carleton Elementary School.
Ownership History
Date
Name
Owned For
Owner Type
Purchase Details
Closed on
Dec 27, 2017
Sold by
21St Mortgage Corp
Bought by
Ramirez Antonio and Perez-Mejia Liana L
Current Estimated Value
Purchase Details
Closed on
Dec 11, 2017
Sold by
21St Mortgage Corp
Bought by
Ramirez Antonio and Perez-Mejia Liana L
Purchase Details
Closed on
Feb 3, 2017
Sold by
Superior Court Of New Jersey
Bought by
21St Mortgage Corporation
Purchase Details
Closed on
Nov 20, 2006
Sold by
Pedrick Florence
Bought by
Maurer Michael S
Home Financials for this Owner
Home Financials are based on the most recent Mortgage that was taken out on this home.
Original Mortgage
$113,000
Interest Rate
6.29%
Mortgage Type
Purchase Money Mortgage
Create a Home Valuation Report for This Property
The Home Valuation Report is an in-depth analysis detailing your home's value as well as a comparison with similar homes in the area
Home Values in the Area
Average Home Value in this Area
Purchase History
| Date | Buyer | Sale Price | Title Company |
|---|---|---|---|
| Ramirez Antonio | $25,000 | -- | |
| Ramirez Antonio | $25,000 | -- | |
| 21St Mortgage Corporation | -- | None Available | |
| Maurer Michael S | $113,000 | Commonwealth Land Title Insu |
Source: Public Records
Mortgage History
| Date | Status | Borrower | Loan Amount |
|---|---|---|---|
| Previous Owner | Maurer Michael S | $113,000 |
Source: Public Records
Tax History Compared to Growth
Tax History
| Year | Tax Paid | Tax Assessment Tax Assessment Total Assessment is a certain percentage of the fair market value that is determined by local assessors to be the total taxable value of land and additions on the property. | Land | Improvement |
|---|---|---|---|---|
| 2025 | $4,225 | $233,100 | $55,400 | $177,700 |
| 2024 | $4,080 | $114,600 | $32,600 | $82,000 |
| 2023 | $4,080 | $114,600 | $32,600 | $82,000 |
| 2022 | $3,839 | $114,600 | $32,600 | $82,000 |
| 2021 | $3,802 | $114,600 | $32,600 | $82,000 |
| 2020 | $3,836 | $114,600 | $32,600 | $82,000 |
| 2019 | $3,868 | $114,600 | $32,600 | $82,000 |
| 2018 | $3,898 | $123,800 | $34,800 | $89,000 |
| 2017 | $3,635 | $123,800 | $34,800 | $89,000 |
| 2016 | $3,935 | $139,100 | $39,800 | $99,300 |
| 2015 | $3,752 | $139,100 | $39,800 | $99,300 |
| 2014 | $3,551 | $139,100 | $39,800 | $99,300 |
Source: Public Records
Map
Nearby Homes