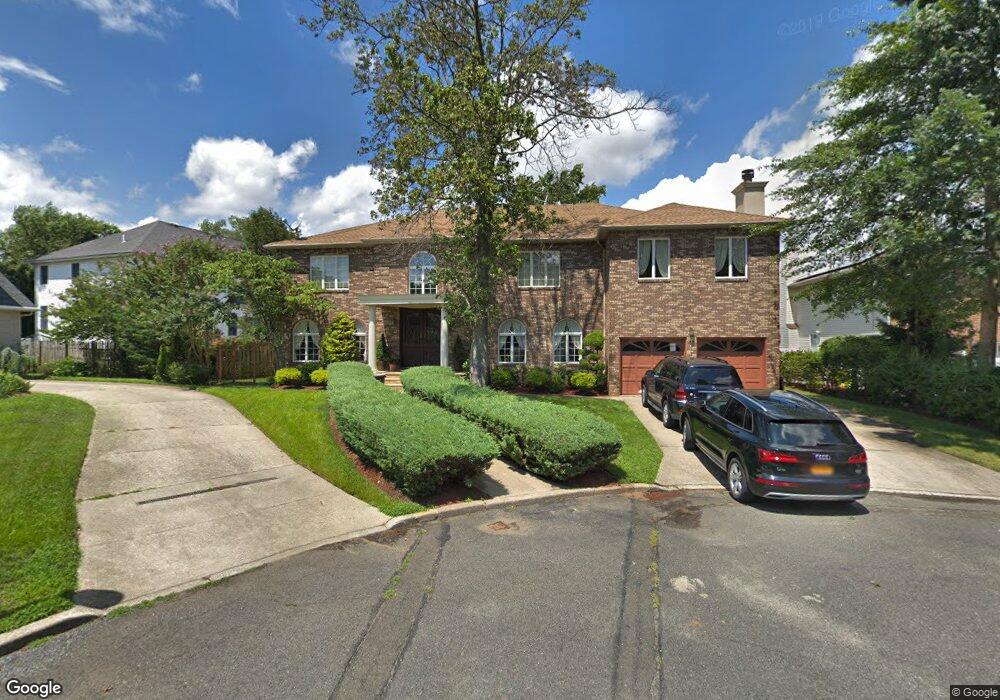
95 Amaron Ln Staten Island, NY 10307
Tottenville NeighborhoodEstimated Value: $1,445,000 - $1,860,031
--
Bed
--
Bath
4,800
Sq Ft
$336/Sq Ft
Est. Value
About This Home
This home is located at 95 Amaron Ln, Staten Island, NY 10307 and is currently estimated at $1,614,258, approximately $336 per square foot. 95 Amaron Ln is a home located in Richmond County with nearby schools including P.S. 6 Cpl Allan F Kivlehan School, Is 34 Tottenville, and Tottenville High School.
Ownership History
Date
Name
Owned For
Owner Type
Purchase Details
Closed on
Nov 30, 2000
Sold by
Calogera Dennis and Calogera Dennis D
Bought by
Digiacomo Vincenzo and Digiacomo Maria
Current Estimated Value
Home Financials for this Owner
Home Financials are based on the most recent Mortgage that was taken out on this home.
Original Mortgage
$400,000
Outstanding Balance
$146,767
Interest Rate
7.64%
Estimated Equity
$1,467,491
Purchase Details
Closed on
Sep 13, 2000
Sold by
The Estate Of Thelma R Calogera
Bought by
Calogera Dennis
Create a Home Valuation Report for This Property
The Home Valuation Report is an in-depth analysis detailing your home's value as well as a comparison with similar homes in the area
Home Values in the Area
Average Home Value in this Area
Purchase History
| Date | Buyer | Sale Price | Title Company |
|---|---|---|---|
| Digiacomo Vincenzo | $650,000 | Commonwealth Land Title Ins | |
| Calogera Dennis | -- | -- |
Source: Public Records
Mortgage History
| Date | Status | Borrower | Loan Amount |
|---|---|---|---|
| Open | Digiacomo Vincenzo | $400,000 |
Source: Public Records
Tax History Compared to Growth
Tax History
| Year | Tax Paid | Tax Assessment Tax Assessment Total Assessment is a certain percentage of the fair market value that is determined by local assessors to be the total taxable value of land and additions on the property. | Land | Improvement |
|---|---|---|---|---|
| 2025 | $14,895 | $86,340 | $13,875 | $72,465 |
| 2024 | $14,895 | $84,420 | $13,387 | $71,033 |
| 2023 | $14,208 | $69,960 | $13,829 | $56,131 |
| 2022 | $13,176 | $66,000 | $15,240 | $50,760 |
| 2021 | $14,382 | $68,340 | $15,240 | $53,100 |
| 2020 | $13,999 | $66,240 | $15,240 | $51,000 |
| 2019 | $13,052 | $66,240 | $15,240 | $51,000 |
| 2018 | $11,999 | $58,860 | $15,240 | $43,620 |
| 2017 | $11,840 | $58,080 | $15,240 | $42,840 |
| 2016 | $11,824 | $59,148 | $13,670 | $45,478 |
| 2015 | $9,903 | $55,800 | $16,920 | $38,880 |
| 2014 | $9,903 | $51,600 | $16,920 | $34,680 |
Source: Public Records
Map
Nearby Homes