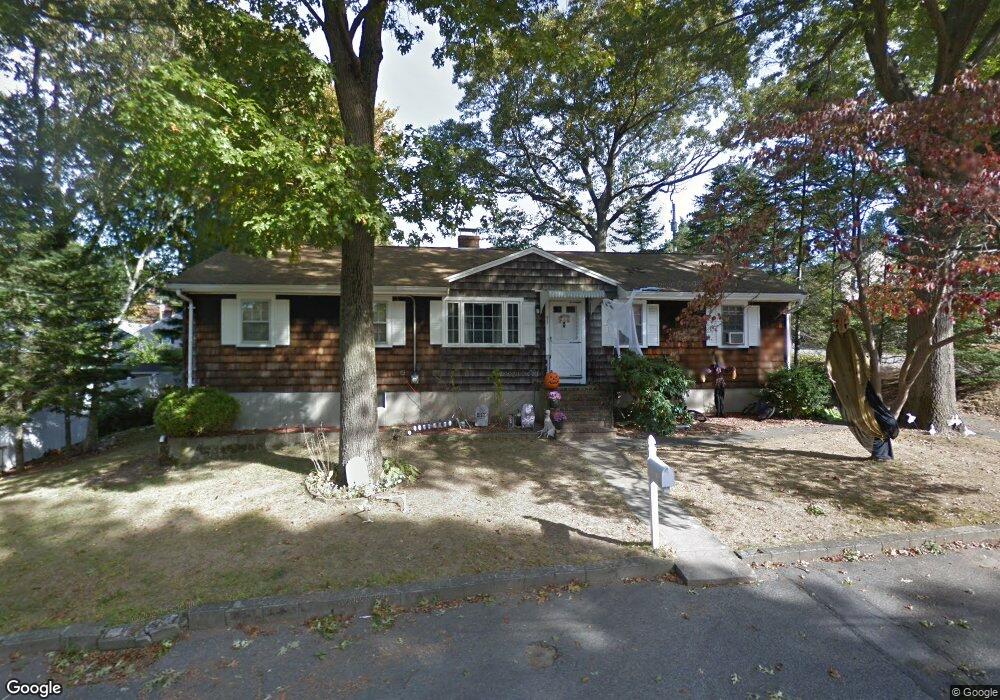
95 Apple Tree Ln Weymouth, MA 02188
Weymouth Landing NeighborhoodEstimated Value: $594,000 - $630,000
3
Beds
2
Baths
1,344
Sq Ft
$457/Sq Ft
Est. Value
About This Home
This home is located at 95 Apple Tree Ln, Weymouth, MA 02188 and is currently estimated at $614,242, approximately $457 per square foot. 95 Apple Tree Ln is a home located in Norfolk County with nearby schools including Frederick C Murphy, Abigail Adams Middle School, and Weymouth Middle School Chapman.
Ownership History
Date
Name
Owned For
Owner Type
Purchase Details
Closed on
Jun 23, 2006
Sold by
Walker Colin J and Walker Gary J
Bought by
Savage Cristy A and Savage Jonathan C
Current Estimated Value
Home Financials for this Owner
Home Financials are based on the most recent Mortgage that was taken out on this home.
Original Mortgage
$284,000
Outstanding Balance
$167,156
Interest Rate
6.59%
Mortgage Type
Purchase Money Mortgage
Estimated Equity
$447,086
Create a Home Valuation Report for This Property
The Home Valuation Report is an in-depth analysis detailing your home's value as well as a comparison with similar homes in the area
Home Values in the Area
Average Home Value in this Area
Purchase History
| Date | Buyer | Sale Price | Title Company |
|---|---|---|---|
| Savage Cristy A | $355,000 | -- |
Source: Public Records
Mortgage History
| Date | Status | Borrower | Loan Amount |
|---|---|---|---|
| Open | Savage Cristy A | $284,000 | |
| Closed | Savage Cristy A | $71,000 |
Source: Public Records
Tax History Compared to Growth
Tax History
| Year | Tax Paid | Tax Assessment Tax Assessment Total Assessment is a certain percentage of the fair market value that is determined by local assessors to be the total taxable value of land and additions on the property. | Land | Improvement |
|---|---|---|---|---|
| 2025 | $5,115 | $506,400 | $225,600 | $280,800 |
| 2024 | $5,063 | $493,000 | $214,800 | $278,200 |
| 2023 | $4,771 | $456,600 | $198,900 | $257,700 |
| 2022 | $4,758 | $415,200 | $184,200 | $231,000 |
| 2021 | $4,475 | $381,200 | $184,200 | $197,000 |
| 2020 | $4,261 | $357,500 | $184,200 | $173,300 |
| 2019 | $4,145 | $342,000 | $177,100 | $164,900 |
| 2018 | $4,020 | $321,600 | $168,700 | $152,900 |
| 2017 | $3,920 | $306,000 | $160,700 | $145,300 |
| 2016 | $3,823 | $298,700 | $154,500 | $144,200 |
| 2015 | $3,598 | $278,900 | $147,500 | $131,400 |
| 2014 | $3,510 | $263,900 | $137,200 | $126,700 |
Source: Public Records
Map
Nearby Homes
- 24 Blake Rd
- 76 Kingman St
- 15 Summer St
- 33 Congress St
- 16 Lindbergh Ave
- 23-25 Lindbergh Ave
- 11 Richmond St
- 122 Washington St Unit 22
- 230 Lisle St
- 114 Broad St Unit D
- 114 Broad St Unit C
- 19 Vine St Unit 3
- 19 Vine St Unit 1
- 36 Brookside Rd
- 37 Lantern Ln
- 97 Liberty St
- 51 Faxon St
- 141 Commercial St Unit 9
- 200 Justin Dr Unit 3
- 116 Belmont St