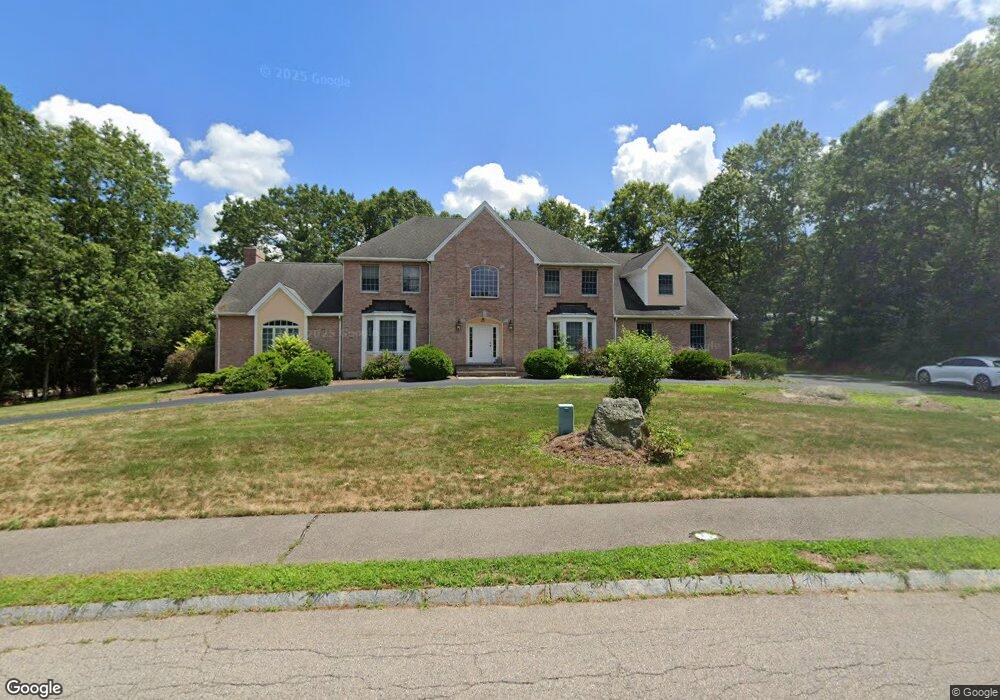
95 Aspen Rd Sharon, MA 02067
Estimated Value: $1,570,549 - $1,836,000
5
Beds
4
Baths
4,232
Sq Ft
$404/Sq Ft
Est. Value
About This Home
This home is located at 95 Aspen Rd, Sharon, MA 02067 and is currently estimated at $1,708,387, approximately $403 per square foot. 95 Aspen Rd is a home located in Norfolk County with nearby schools including East Elementary School, Sharon Middle School, and Sharon High School.
Ownership History
Date
Name
Owned For
Owner Type
Purchase Details
Closed on
Jun 30, 2006
Sold by
Busch Suzanne and Busch William A
Bought by
Bachina Anitha and Maddineni Srinivasa R
Current Estimated Value
Purchase Details
Closed on
Jan 3, 2001
Sold by
Wadsworth Bldrs Inc
Bought by
Busch William A and Busch Suzanne
Purchase Details
Closed on
Feb 2, 2000
Sold by
Goodheart Llc
Bought by
Urmila Rt
Create a Home Valuation Report for This Property
The Home Valuation Report is an in-depth analysis detailing your home's value as well as a comparison with similar homes in the area
Home Values in the Area
Average Home Value in this Area
Purchase History
| Date | Buyer | Sale Price | Title Company |
|---|---|---|---|
| Bachina Anitha | $995,000 | -- | |
| Busch William A | $785,000 | -- | |
| Urmila Rt | $225,000 | -- |
Source: Public Records
Mortgage History
| Date | Status | Borrower | Loan Amount |
|---|---|---|---|
| Open | Urmila Rt | $675,000 | |
| Closed | Urmila Rt | $700,000 |
Source: Public Records
Tax History Compared to Growth
Tax History
| Year | Tax Paid | Tax Assessment Tax Assessment Total Assessment is a certain percentage of the fair market value that is determined by local assessors to be the total taxable value of land and additions on the property. | Land | Improvement |
|---|---|---|---|---|
| 2025 | $25,096 | $1,435,700 | $527,500 | $908,200 |
| 2024 | $24,341 | $1,384,600 | $484,000 | $900,600 |
| 2023 | $22,697 | $1,220,900 | $452,500 | $768,400 |
| 2022 | $21,930 | $1,110,400 | $377,000 | $733,400 |
| 2021 | $21,817 | $1,067,900 | $355,500 | $712,400 |
| 2020 | $20,830 | $1,096,300 | $383,900 | $712,400 |
| 2019 | $21,248 | $1,094,700 | $367,300 | $727,400 |
| 2018 | $21,069 | $1,087,700 | $360,300 | $727,400 |
| 2017 | $20,884 | $1,064,400 | $337,000 | $727,400 |
| 2016 | $20,110 | $1,000,000 | $337,000 | $663,000 |
| 2015 | $19,610 | $966,000 | $298,400 | $667,600 |
| 2014 | $17,883 | $870,200 | $254,000 | $616,200 |
Source: Public Records
Map
Nearby Homes