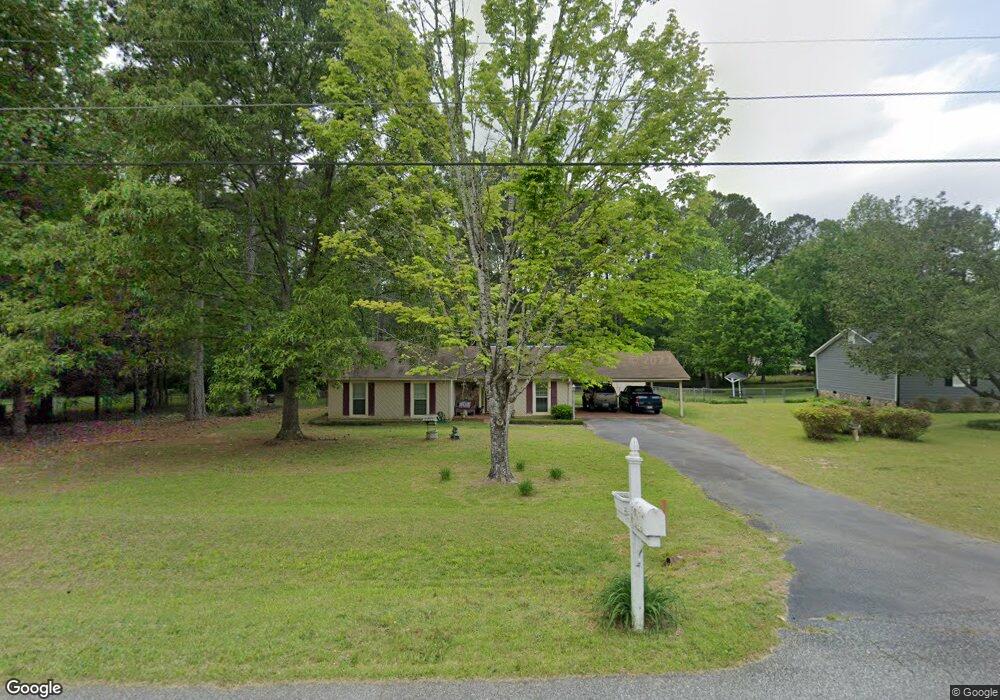
95 Beaver Run Lagrange, GA 30241
Estimated Value: $199,000 - $240,000
3
Beds
2
Baths
1,320
Sq Ft
$165/Sq Ft
Est. Value
About This Home
This home is located at 95 Beaver Run, Lagrange, GA 30241 and is currently estimated at $217,609, approximately $164 per square foot. 95 Beaver Run is a home located in Troup County with nearby schools including Callaway Elementary School, Hogansville Elementary School, and Callaway Middle School.
Ownership History
Date
Name
Owned For
Owner Type
Purchase Details
Closed on
May 25, 2011
Sold by
Mcleroy Bonnie A
Bought by
Sprayberry Bonnie A
Current Estimated Value
Home Financials for this Owner
Home Financials are based on the most recent Mortgage that was taken out on this home.
Original Mortgage
$66,000
Outstanding Balance
$45,184
Interest Rate
4.79%
Mortgage Type
New Conventional
Estimated Equity
$172,425
Purchase Details
Closed on
Aug 5, 1998
Sold by
Glen Rogers
Bought by
Mcleroy Bonnie A
Purchase Details
Closed on
Jan 2, 1987
Sold by
Sullins Benson
Bought by
Glen Rogers
Purchase Details
Closed on
Apr 4, 1980
Sold by
Butler Iii John A C and Butler Sandra J C
Bought by
Sullins Benson
Purchase Details
Closed on
Mar 30, 1979
Sold by
Jerry Averett Cont Inc
Bought by
Butler Iii John A C and Butler Sandra J C
Purchase Details
Closed on
Jul 18, 1978
Sold by
Daniel Evans Dev Corp
Bought by
Jerry Averett Cont Inc
Purchase Details
Closed on
Oct 23, 1975
Bought by
Daniel Evans Dev Corp
Purchase Details
Closed on
Aug 4, 1975
Create a Home Valuation Report for This Property
The Home Valuation Report is an in-depth analysis detailing your home's value as well as a comparison with similar homes in the area
Purchase History
| Date | Buyer | Sale Price | Title Company |
|---|---|---|---|
| Sprayberry Bonnie A | -- | -- | |
| Mcleroy Bonnie A | $78,000 | -- | |
| Glen Rogers | $57,900 | -- | |
| Sullins Benson | -- | -- | |
| Butler Iii John A C | -- | -- | |
| Jerry Averett Cont Inc | -- | -- | |
| Daniel Evans Dev Corp | -- | -- | |
| -- | -- | -- |
Source: Public Records
Mortgage History
| Date | Status | Borrower | Loan Amount |
|---|---|---|---|
| Open | Sprayberry Bonnie A | $66,000 |
Source: Public Records
Tax History
| Year | Tax Paid | Tax Assessment Tax Assessment Total Assessment is a certain percentage of the fair market value that is determined by local assessors to be the total taxable value of land and additions on the property. | Land | Improvement |
|---|---|---|---|---|
| 2025 | $956 | $68,320 | $10,000 | $58,320 |
| 2024 | $956 | $64,120 | $10,000 | $54,120 |
| 2023 | $949 | $63,840 | $10,000 | $53,840 |
| 2022 | $924 | $61,720 | $10,000 | $51,720 |
| 2021 | $457 | $43,880 | $8,000 | $35,880 |
| 2020 | $1,023 | $43,880 | $8,000 | $35,880 |
| 2019 | $843 | $37,920 | $4,800 | $33,120 |
| 2018 | $700 | $33,160 | $4,800 | $28,360 |
| 2017 | $700 | $33,160 | $4,800 | $28,360 |
| 2016 | $673 | $32,264 | $4,800 | $27,464 |
| 2015 | $674 | $32,264 | $4,800 | $27,464 |
| 2014 | $630 | $30,818 | $4,800 | $26,018 |
| 2013 | -- | $32,009 | $4,800 | $27,209 |
Source: Public Records
Map
Nearby Homes
- 106 Beaver Run
- 228 Sivell Rd
- 119 Sir Lancelot St
- 10 Whitfield Rd
- SMOKEMONT Smokemont Dr
- 234 River Meadow Dr
- 200 River Meadow Dr
- Hemingway Plan at Crossvine Village
- Mira Plan at Crossvine Village
- Cecil Plan at Crossvine Village
- Tucker FP Plan at Crossvine Village
- Sierra Plan at Crossvine Village
- Jodeco FP Plan at Crossvine Village
- Nottely Plan at Crossvine Village
- Carter Plan at Crossvine Village
- Winston Plan at Crossvine Village
- Nelson Plan at Crossvine Village
- Madison Plan at Crossvine Village
- 206 Freshwater Ct Unit 34E
- 206 Freshwater Ct
- 93 Beaver Run
- 97 Beaver Run
- 94 Clearwater Dr
- 92 Clearwater Dr
- 99 Beaver Run
- 96 Beaver Run
- 91 Beaver Run
- 94 Beaver Run
- 90 Clearwater Dr
- 96 Clearwater Dr
- 33 Beaver Run Unit 24
- 98 Beaver Run
- 92 Beaver Run
- 98 Clearwater Dr
- 88 Clearwater Dr
- 89 Beaver Run
- 90 Beaver Run
- 205 Moccasin Trail
- 207 Moccasin Trail
- 100 Beaver Run