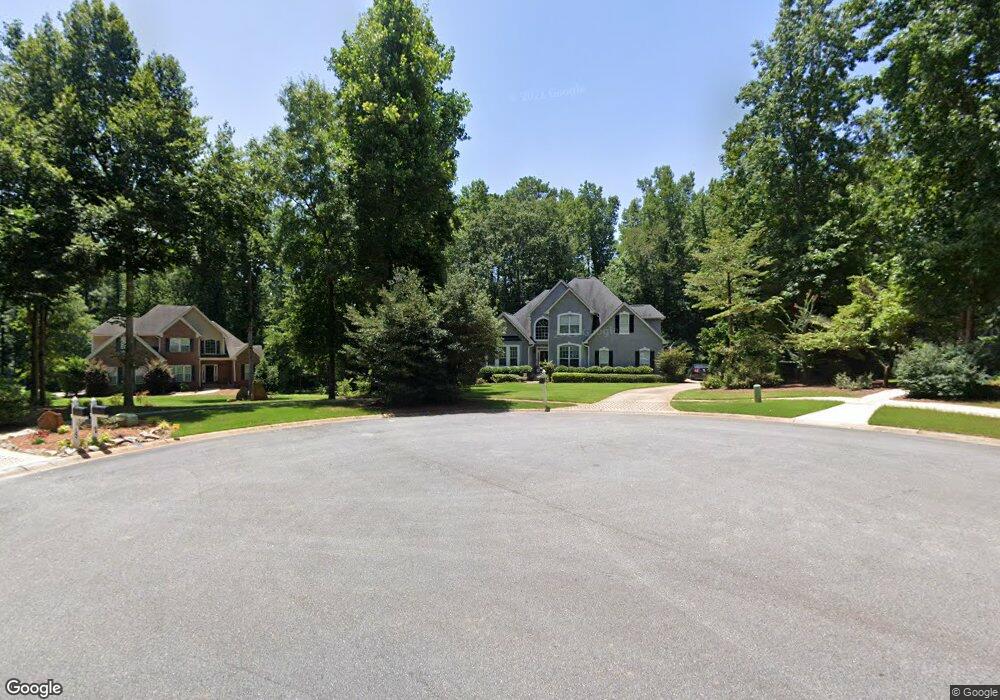
95 Bellview Ridge Sharpsburg, GA 30277
Estimated Value: $575,000 - $731,000
4
Beds
4
Baths
2,957
Sq Ft
$214/Sq Ft
Est. Value
About This Home
This home is located at 95 Bellview Ridge, Sharpsburg, GA 30277 and is currently estimated at $632,101, approximately $213 per square foot. 95 Bellview Ridge is a home located in Coweta County with nearby schools including Canongate Elementary School, Madras Middle School, and Northgate High School.
Ownership History
Date
Name
Owned For
Owner Type
Purchase Details
Closed on
Mar 30, 1999
Sold by
Benchmark Classic Homes Inc
Bought by
Malally Robert T and Malally Catheri
Current Estimated Value
Home Financials for this Owner
Home Financials are based on the most recent Mortgage that was taken out on this home.
Original Mortgage
$239,999
Outstanding Balance
$57,196
Interest Rate
6.82%
Mortgage Type
New Conventional
Estimated Equity
$574,905
Purchase Details
Closed on
Sep 22, 1998
Sold by
Frenchy Communtiy Development
Bought by
Benchmark Classic Homes
Home Financials for this Owner
Home Financials are based on the most recent Mortgage that was taken out on this home.
Original Mortgage
$181,600
Interest Rate
9.5%
Mortgage Type
Construction
Purchase Details
Closed on
Nov 23, 1992
Sold by
Glass Lamar F Dr Et
Bought by
Frenchy Community De
Purchase Details
Closed on
Feb 20, 1973
Bought by
Glass Lamar F Dr Et
Create a Home Valuation Report for This Property
The Home Valuation Report is an in-depth analysis detailing your home's value as well as a comparison with similar homes in the area
Home Values in the Area
Average Home Value in this Area
Purchase History
| Date | Buyer | Sale Price | Title Company |
|---|---|---|---|
| Malally Robert T | $261,100 | -- | |
| Benchmark Classic Homes | $38,200 | -- | |
| Benchmark Classic Ho | $38,100 | -- | |
| Frenchy Community De | $1,185,900 | -- | |
| Glass Lamar F Dr Et | $123,600 | -- |
Source: Public Records
Mortgage History
| Date | Status | Borrower | Loan Amount |
|---|---|---|---|
| Open | Malally Robert T | $239,999 | |
| Previous Owner | Benchmark Classic Ho | $181,600 |
Source: Public Records
Tax History Compared to Growth
Tax History
| Year | Tax Paid | Tax Assessment Tax Assessment Total Assessment is a certain percentage of the fair market value that is determined by local assessors to be the total taxable value of land and additions on the property. | Land | Improvement |
|---|---|---|---|---|
| 2025 | $5,595 | $248,081 | $32,000 | $216,081 |
| 2024 | $5,151 | $224,416 | $32,000 | $192,416 |
| 2023 | $5,151 | $221,572 | $32,000 | $189,572 |
| 2022 | $5,164 | $212,369 | $32,000 | $180,369 |
| 2021 | $4,616 | $178,204 | $20,000 | $158,204 |
| 2020 | $4,646 | $178,204 | $20,000 | $158,204 |
| 2019 | $4,808 | $167,430 | $20,000 | $147,430 |
| 2018 | $4,817 | $167,430 | $20,000 | $147,430 |
| 2017 | $4,470 | $155,636 | $20,000 | $135,636 |
| 2016 | $4,419 | $155,636 | $20,000 | $135,636 |
| 2015 | $3,945 | $141,483 | $20,000 | $121,483 |
| 2014 | $3,335 | $122,612 | $20,000 | $102,612 |
Source: Public Records
Map
Nearby Homes
- 28 Border Point
- 110 Kylemore Pass
- 104 Ashland Trail
- 100 Ashland Trail
- 150 Kylemore Pass
- 100 Clydesdale Ct
- 200 Chaparral Trace
- 135 Crimson Ridge
- 2185 Castle Lake Dr
- 575 Laurelwood Dr
- 20 Skipton Ct
- 11 Line Creek Cir
- 121 Northwoods Rd
- 9 Warrior Way
- 70 N Strathmore Dr
- 475 Castlewood Rd
- 259 Strathmore Dr Unit 3
- 40 Wenham Ln
- 240 Lynnwood Ave
- 95 Tyler Woods Dr
- 85 Bellview Ridge
- 100 Tanqueray St
- 90 Tanqueray St
- 94 Bellview Ridge
- 50 Tanqueray St
- 110 Tanqueray St
- 75 Bellview Ridge
- 80 Tanqueray St
- 40 Tanqueray St
- 111 Bellview Ridge
- 90 Bellview Ridge
- 80 Bellview Ridge
- 0 Tanqueray St Unit 8334460
- 0 Tanqueray St Unit 8163763
- 0 Tanqueray St Unit 7634061
- 0 Tanqueray St
- 65 Bellview Ridge
- 30 Tanqueray St
- 120 Tanqueray St
- 70 Bellview Ridge