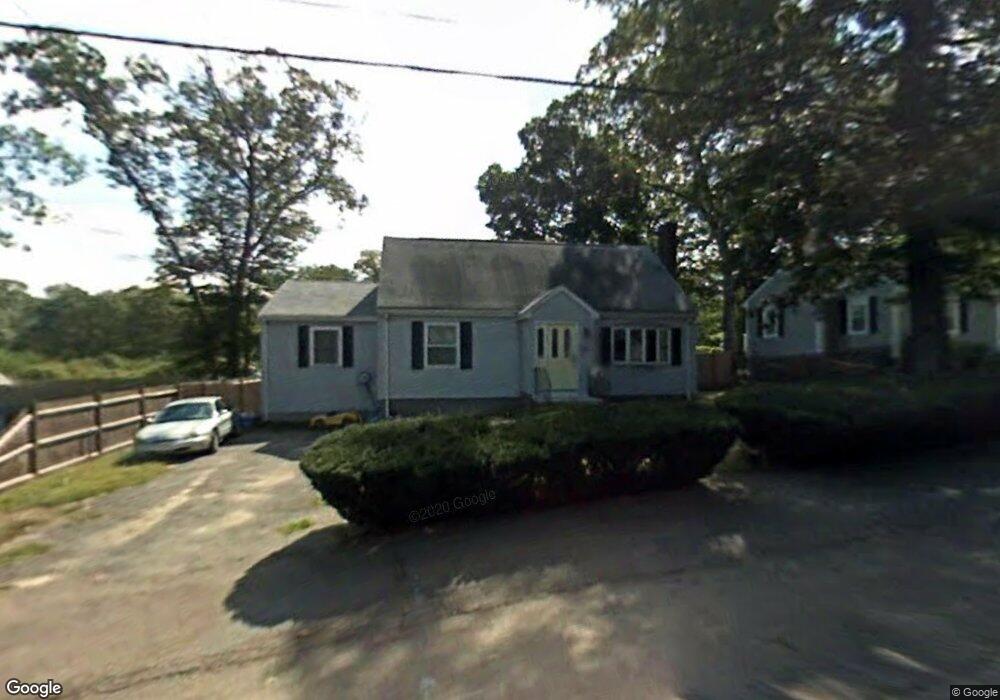
95 Belmont St Weymouth, MA 02188
South Weymouth NeighborhoodEstimated Value: $726,373 - $836,000
3
Beds
2
Baths
2,196
Sq Ft
$352/Sq Ft
Est. Value
About This Home
This home is located at 95 Belmont St, Weymouth, MA 02188 and is currently estimated at $772,593, approximately $351 per square foot. 95 Belmont St is a home located in Norfolk County with nearby schools including Frederick C Murphy, Abigail Adams Middle School, and Weymouth Middle School Chapman.
Ownership History
Date
Name
Owned For
Owner Type
Purchase Details
Closed on
Aug 12, 2024
Sold by
Hanson Barbara J
Bought by
Barbara J Hanson T J and Barbara Hanson
Current Estimated Value
Purchase Details
Closed on
Dec 7, 2004
Sold by
Hanson Barbara J and Hanson Paul M
Bought by
Hanson Barbara J
Create a Home Valuation Report for This Property
The Home Valuation Report is an in-depth analysis detailing your home's value as well as a comparison with similar homes in the area
Home Values in the Area
Average Home Value in this Area
Purchase History
| Date | Buyer | Sale Price | Title Company |
|---|---|---|---|
| Barbara J Hanson T J | -- | None Available | |
| Barbara J Hanson T J | -- | None Available | |
| Hanson Barbara J | -- | -- | |
| Hanson Barbara J | -- | -- |
Source: Public Records
Mortgage History
| Date | Status | Borrower | Loan Amount |
|---|---|---|---|
| Previous Owner | Hanson Barbara J | $38,000 | |
| Previous Owner | Hanson Barbara J | $95,000 |
Source: Public Records
Tax History Compared to Growth
Tax History
| Year | Tax Paid | Tax Assessment Tax Assessment Total Assessment is a certain percentage of the fair market value that is determined by local assessors to be the total taxable value of land and additions on the property. | Land | Improvement |
|---|---|---|---|---|
| 2025 | $6,562 | $649,700 | $244,600 | $405,100 |
| 2024 | $6,428 | $625,900 | $233,000 | $392,900 |
| 2023 | $6,126 | $586,200 | $215,700 | $370,500 |
| 2022 | $5,890 | $514,000 | $183,100 | $330,900 |
| 2021 | $5,584 | $475,600 | $183,100 | $292,500 |
| 2020 | $5,425 | $455,100 | $183,100 | $272,000 |
| 2019 | $5,340 | $440,600 | $176,100 | $264,500 |
| 2018 | $5,255 | $420,400 | $167,700 | $252,700 |
| 2017 | $4,672 | $364,700 | $159,700 | $205,000 |
| 2016 | $4,575 | $357,400 | $153,600 | $203,800 |
| 2015 | $4,361 | $338,100 | $146,600 | $191,500 |
| 2014 | $4,118 | $309,600 | $136,400 | $173,200 |
Source: Public Records
Map
Nearby Homes
- 116 Belmont St
- 501 Commerce Dr Unit 2310
- 501 Commerce Dr Unit 1111
- 501 Commerce Dr Unit 4206
- 501 Commerce Dr Unit 4308
- 501 Commerce Dr Unit 4306
- 655 Summer St
- 200 Justin Dr Unit 3
- 255 West St
- 262 West St
- 92 Mercury St
- 432 Grove St
- 441 Grove St
- 2 Tara Dr Unit 1
- 48 Apple Tree Ln
- 54 Federal St
- 972 Liberty St
- 308 Forest St
- 24 Blake Rd
- 2 Mitchell Ln Unit B