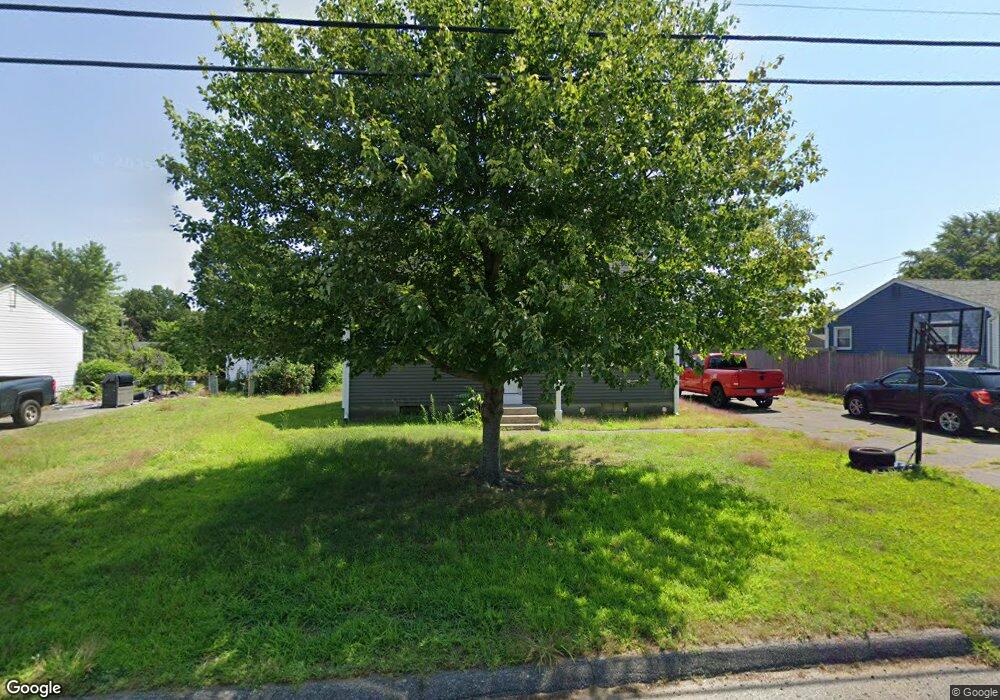
95 Boutin St Chicopee, MA 01020
Fairview NeighborhoodEstimated Value: $270,000 - $353,000
4
Beds
1
Bath
1,031
Sq Ft
$300/Sq Ft
Est. Value
About This Home
This home is located at 95 Boutin St, Chicopee, MA 01020 and is currently estimated at $309,435, approximately $300 per square foot. 95 Boutin St is a home located in Hampden County with nearby schools including Bowie Elementary School, Fairview Middle School, and Chicopee Comprehensive High School.
Ownership History
Date
Name
Owned For
Owner Type
Purchase Details
Closed on
May 4, 2021
Sold by
Meade Francis J 3Rd Est
Bought by
Meade Guy C
Current Estimated Value
Home Financials for this Owner
Home Financials are based on the most recent Mortgage that was taken out on this home.
Original Mortgage
$120,000
Outstanding Balance
$108,580
Interest Rate
3%
Mortgage Type
Purchase Money Mortgage
Estimated Equity
$200,855
Purchase Details
Closed on
Mar 24, 2008
Sold by
Bonville Pearl M
Bought by
Meade Francis J
Purchase Details
Closed on
Nov 22, 2005
Sold by
Bonville Pearl M
Bought by
Meade Francis J
Home Financials for this Owner
Home Financials are based on the most recent Mortgage that was taken out on this home.
Original Mortgage
$120,000
Interest Rate
6.07%
Mortgage Type
Purchase Money Mortgage
Create a Home Valuation Report for This Property
The Home Valuation Report is an in-depth analysis detailing your home's value as well as a comparison with similar homes in the area
Home Values in the Area
Average Home Value in this Area
Purchase History
| Date | Buyer | Sale Price | Title Company |
|---|---|---|---|
| Meade Guy C | $150,000 | None Available | |
| Meade Francis J | $150,000 | -- | |
| Meade Francis J | $150,000 | -- |
Source: Public Records
Mortgage History
| Date | Status | Borrower | Loan Amount |
|---|---|---|---|
| Open | Meade Guy C | $120,000 | |
| Previous Owner | Meade Francis J | $120,000 |
Source: Public Records
Tax History
| Year | Tax Paid | Tax Assessment Tax Assessment Total Assessment is a certain percentage of the fair market value that is determined by local assessors to be the total taxable value of land and additions on the property. | Land | Improvement |
|---|---|---|---|---|
| 2025 | $4,080 | $269,100 | $112,900 | $156,200 |
| 2024 | $3,872 | $262,300 | $110,600 | $151,700 |
| 2023 | $3,634 | $239,900 | $100,600 | $139,300 |
| 2022 | $3,563 | $209,700 | $87,400 | $122,300 |
| 2021 | $3,432 | $194,900 | $79,500 | $115,400 |
| 2020 | $3,317 | $190,000 | $81,600 | $108,400 |
| 2019 | $3,287 | $183,000 | $81,600 | $101,400 |
| 2018 | $3,197 | $174,600 | $77,800 | $96,800 |
| 2017 | $2,666 | $154,000 | $71,300 | $82,700 |
| 2016 | $2,619 | $154,900 | $71,300 | $83,600 |
| 2015 | $2,696 | $153,700 | $71,300 | $82,400 |
| 2014 | $1,348 | $153,700 | $71,300 | $82,400 |
Source: Public Records
Map
Nearby Homes
- 37 Greenwood Terrace
- 52 Falmouth Rd
- 179 Greenwood Terrace
- 180 Fletcher Cir
- 104 Johnson Rd Unit 707
- 119 Oakridge St
- 210 Johnson Rd Unit 23
- 1760 Westover Rd Unit 2
- 1697 Westover Rd
- 72 Holiday Cir
- 111 Festival Cir
- 81 Mccarthy Ave
- 523 James St
- 340 Pendleton Ave
- 39 Mccarthy Ave
- 15 Nelligan Dr
- 103 Lauzier Terrace
- 40 Lauzier Terrace
- 585 Sheridan St Unit 46
- 134 Lukasik St