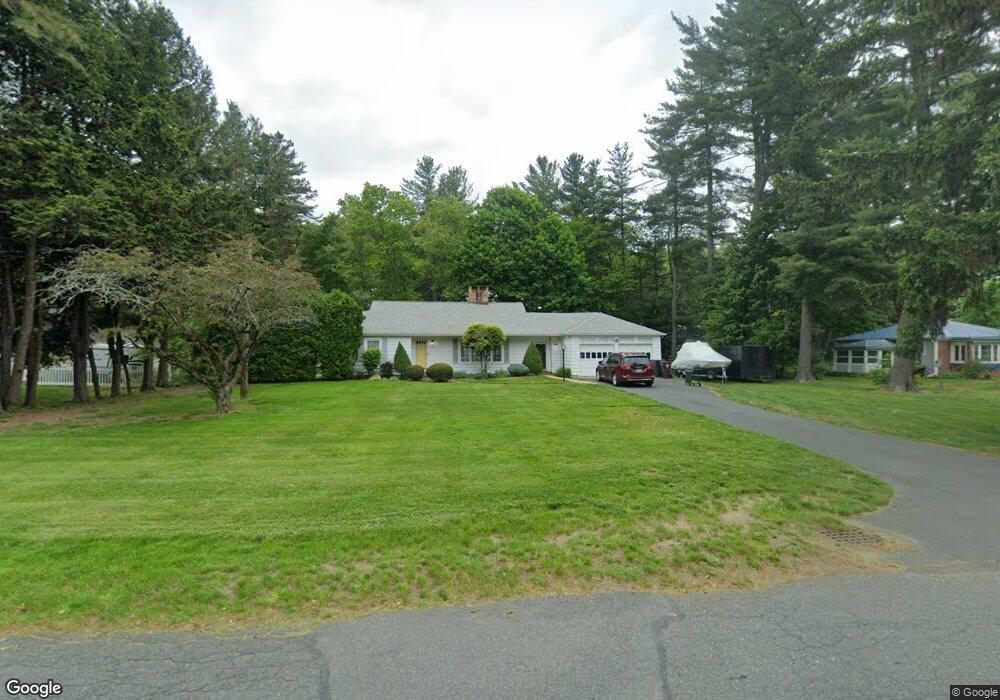
95 Broadway Westfield, MA 01085
Estimated Value: $375,272 - $502,000
3
Beds
2
Baths
1,584
Sq Ft
$267/Sq Ft
Est. Value
About This Home
This home is located at 95 Broadway, Westfield, MA 01085 and is currently estimated at $423,068, approximately $267 per square foot. 95 Broadway is a home located in Hampden County with nearby schools including Westfield High School and Saint Mary High School.
Ownership History
Date
Name
Owned For
Owner Type
Purchase Details
Closed on
Jul 12, 1994
Sold by
Ardery Patricia A
Bought by
Cody Frank S and Shepard-Cody Rachel
Current Estimated Value
Home Financials for this Owner
Home Financials are based on the most recent Mortgage that was taken out on this home.
Original Mortgage
$110,960
Interest Rate
8.51%
Mortgage Type
Purchase Money Mortgage
Purchase Details
Closed on
Sep 23, 1988
Sold by
Corson Floyd
Bought by
Anton Patricia A
Create a Home Valuation Report for This Property
The Home Valuation Report is an in-depth analysis detailing your home's value as well as a comparison with similar homes in the area
Home Values in the Area
Average Home Value in this Area
Purchase History
| Date | Buyer | Sale Price | Title Company |
|---|---|---|---|
| Cody Frank S | $138,700 | -- | |
| Anton Patricia A | $154,900 | -- |
Source: Public Records
Mortgage History
| Date | Status | Borrower | Loan Amount |
|---|---|---|---|
| Open | Anton Patricia A | $60,000 | |
| Open | Anton Patricia A | $108,000 | |
| Closed | Anton Patricia A | $110,960 | |
| Previous Owner | Anton Patricia A | $250,000 |
Source: Public Records
Tax History
| Year | Tax Paid | Tax Assessment Tax Assessment Total Assessment is a certain percentage of the fair market value that is determined by local assessors to be the total taxable value of land and additions on the property. | Land | Improvement |
|---|---|---|---|---|
| 2025 | $4,861 | $320,200 | $117,000 | $203,200 |
| 2024 | $4,943 | $309,500 | $106,300 | $203,200 |
| 2023 | $4,746 | $279,500 | $101,100 | $178,400 |
| 2022 | $4,567 | $247,000 | $90,200 | $156,800 |
| 2021 | $4,251 | $234,300 | $85,100 | $149,200 |
| 2020 | $4,291 | $222,900 | $85,100 | $137,800 |
| 2019 | $4,190 | $213,000 | $81,000 | $132,000 |
| 2018 | $4,124 | $213,000 | $81,000 | $132,000 |
| 2017 | $3,230 | $208,600 | $82,300 | $126,300 |
| 2016 | $4,055 | $208,600 | $82,300 | $126,300 |
| 2015 | $3,867 | $208,600 | $82,300 | $126,300 |
| 2014 | $2,892 | $208,600 | $82,300 | $126,300 |
Source: Public Records
Map
Nearby Homes
- 44 Kensington Ave
- 324 Russell Rd Unit 204
- 324 Russell Rd Unit 109
- 324 Russell Rd Unit 101
- 42 Putnam Dr
- 0 Fox Hill Dr
- 60 Mill St
- 70 S Maple St
- 74 S Maple St
- 113 Franklin St
- 40 Hawks Cir
- 44 Llewellyn Dr
- 13 Green Ave
- 16 Squawfield Rd
- 91 Squawfield Rd
- 19 Kellogg St
- 4 Belmont St
- 76 Kane Brothers Cir
- 3 Belmont St
- 419 Southwick Rd Unit P66
Your Personal Tour Guide
Ask me questions while you tour the home.