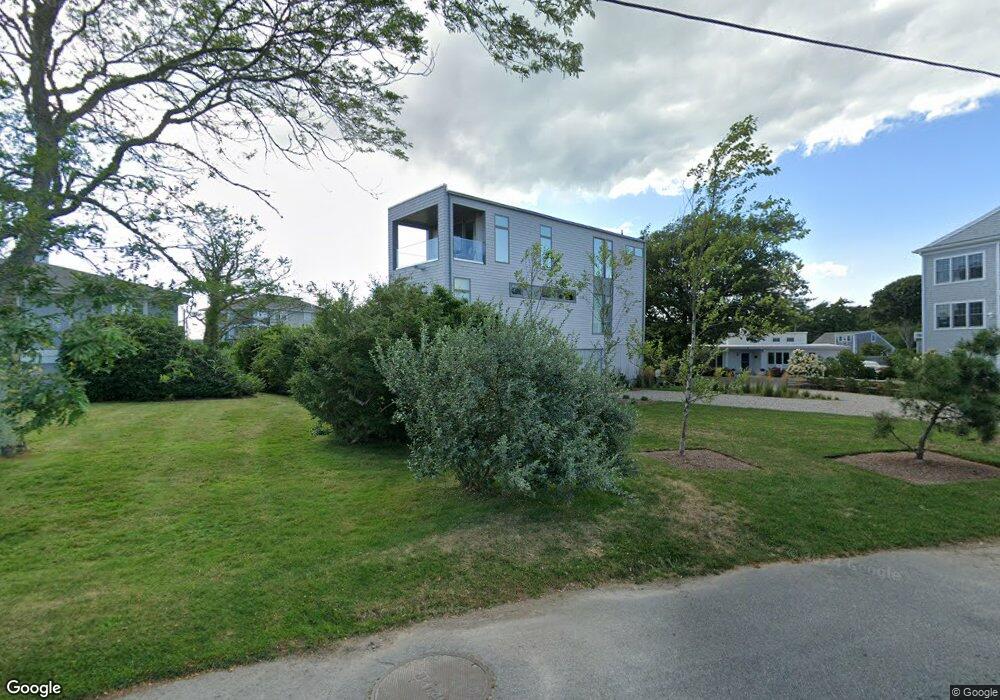
95 Bywater Ct Falmouth, MA 02540
Falmouth Village NeighborhoodEstimated Value: $1,383,000 - $1,773,692
3
Beds
3
Baths
1,419
Sq Ft
$1,093/Sq Ft
Est. Value
About This Home
This home is located at 95 Bywater Ct, Falmouth, MA 02540 and is currently estimated at $1,551,673, approximately $1,093 per square foot. 95 Bywater Ct is a home located in Barnstable County with nearby schools including Mullen-Hall School, Lawrence School, and Morse Pond School.
Ownership History
Date
Name
Owned For
Owner Type
Purchase Details
Closed on
Jul 14, 2021
Sold by
Cipro Anthony M
Bought by
Jackson Joseph B and Puchyr Lindsey J
Current Estimated Value
Home Financials for this Owner
Home Financials are based on the most recent Mortgage that was taken out on this home.
Original Mortgage
$767,700
Outstanding Balance
$693,541
Interest Rate
2.9%
Mortgage Type
New Conventional
Estimated Equity
$858,132
Create a Home Valuation Report for This Property
The Home Valuation Report is an in-depth analysis detailing your home's value as well as a comparison with similar homes in the area
Home Values in the Area
Average Home Value in this Area
Purchase History
| Date | Buyer | Sale Price | Title Company |
|---|---|---|---|
| Jackson Joseph B | $480,000 | None Available |
Source: Public Records
Mortgage History
| Date | Status | Borrower | Loan Amount |
|---|---|---|---|
| Open | Jackson Joseph B | $767,700 |
Source: Public Records
Tax History Compared to Growth
Tax History
| Year | Tax Paid | Tax Assessment Tax Assessment Total Assessment is a certain percentage of the fair market value that is determined by local assessors to be the total taxable value of land and additions on the property. | Land | Improvement |
|---|---|---|---|---|
| 2025 | $7,627 | $1,299,400 | $582,700 | $716,700 |
| 2024 | $7,322 | $1,165,900 | $506,300 | $659,600 |
| 2023 | $3,312 | $478,600 | $466,600 | $12,000 |
| 2022 | $5,682 | $705,900 | $705,900 | $0 |
| 2021 | $5,739 | $675,200 | $675,200 | $0 |
| 2020 | $5,273 | $613,900 | $613,900 | $0 |
| 2019 | $5,255 | $613,900 | $613,900 | $0 |
| 2018 | $3,407 | $613,900 | $613,900 | $0 |
| 2017 | $5,237 | $613,900 | $613,900 | $0 |
| 2016 | $5,138 | $613,900 | $613,900 | $0 |
| 2015 | $3,609 | $440,700 | $440,700 | $0 |
| 2014 | $3,452 | $423,600 | $423,600 | $0 |
Source: Public Records
Map
Nearby Homes
- 15 Hedge Ln
- 65 Walker St
- 71 Main St
- 98 Main St
- 98 Main St Unit 1
- 30 Katherine Lee Bates Rd
- 253 Scranton Ave
- 38 Landfall Unit 38
- 38 Landfall
- 480 Main St Unit 1
- 33 Oakwood Ave
- 87 Oyster Pond Rd
- 9 Fairmount Ave Unit 1
- 9 Fairmount Ave
- 110 Dillingham Ave Unit 322
- 286 Grand Ave Unit 6
- 286 Grand Ave Unit 8
- 286 Grand Ave Unit 4
- 55 Jericho Path
- 251 Woods Hole Rd
- 89 Bywater Ct
- 75 Bywater Ct
- 34 Fresh River Ln
- 91 Bywater Ct
- 42 Fresh River Ln
- 24 Fresh River Ln
- 96 Bywater Ct
- 99 Bywater Ct
- 71 Bywater Ct
- 12 Fresh River Ln
- 46 Fresh River Ln
- 27 Fresh River Ln
- 76 Bywater Ct
- 39 Fresh River Ln
- 105 Bywater Ct
- 63 Bywater Ct
- 19 Seagull Ln
- 72 Bywater Ct
- 50 Fresh River Ln
- 15 Seagull Ln