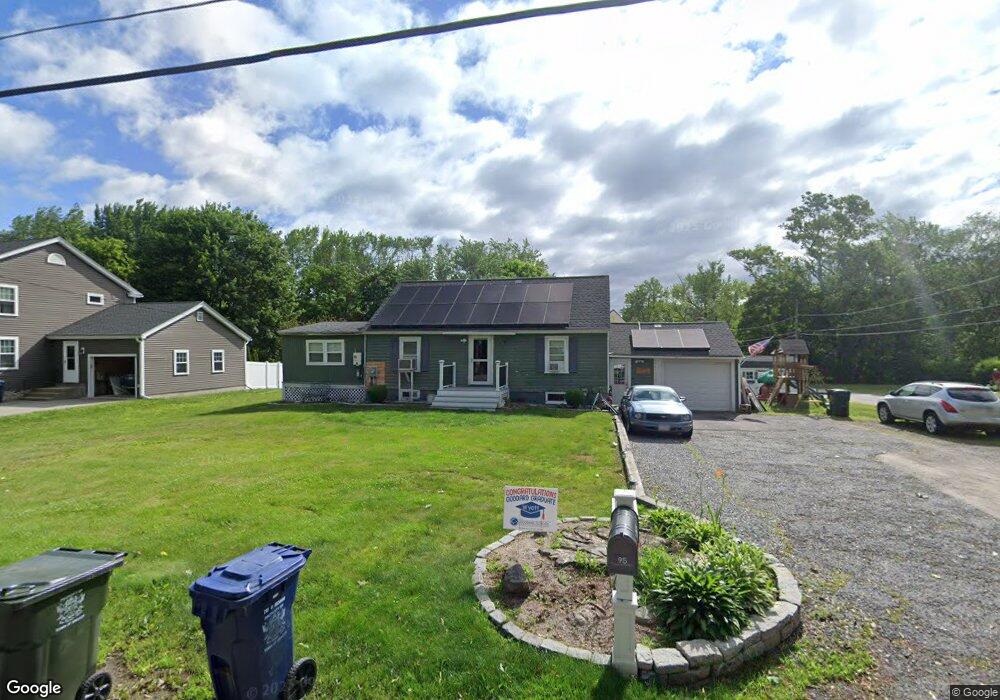
95 Chapman St Dracut, MA 01826
Estimated Value: $433,751 - $598,000
2
Beds
1
Bath
1,094
Sq Ft
$464/Sq Ft
Est. Value
About This Home
This home is located at 95 Chapman St, Dracut, MA 01826 and is currently estimated at $507,438, approximately $463 per square foot. 95 Chapman St is a home located in Middlesex County with nearby schools including Greenmont Avenue School, Richardson Middle School, and Dracut Senior High School.
Ownership History
Date
Name
Owned For
Owner Type
Purchase Details
Closed on
Sep 18, 1997
Sold by
Calkins Edward J Est
Bought by
Ouellette David R
Current Estimated Value
Home Financials for this Owner
Home Financials are based on the most recent Mortgage that was taken out on this home.
Original Mortgage
$81,600
Outstanding Balance
$12,546
Interest Rate
7.38%
Mortgage Type
Purchase Money Mortgage
Estimated Equity
$494,892
Create a Home Valuation Report for This Property
The Home Valuation Report is an in-depth analysis detailing your home's value as well as a comparison with similar homes in the area
Home Values in the Area
Average Home Value in this Area
Purchase History
| Date | Buyer | Sale Price | Title Company |
|---|---|---|---|
| Ouellette David R | $102,000 | -- |
Source: Public Records
Mortgage History
| Date | Status | Borrower | Loan Amount |
|---|---|---|---|
| Open | Ouellette David R | $81,600 | |
| Previous Owner | Ouellette David R | $10,000 | |
| Previous Owner | Ouellette David R | $45,000 | |
| Previous Owner | Ouellette David R | $30,000 |
Source: Public Records
Tax History
| Year | Tax Paid | Tax Assessment Tax Assessment Total Assessment is a certain percentage of the fair market value that is determined by local assessors to be the total taxable value of land and additions on the property. | Land | Improvement |
|---|---|---|---|---|
| 2025 | $3,825 | $378,000 | $198,000 | $180,000 |
| 2024 | $3,700 | $354,100 | $188,600 | $165,500 |
| 2023 | $3,565 | $307,900 | $164,000 | $143,900 |
| 2022 | $3,467 | $282,100 | $149,000 | $133,100 |
| 2021 | $3,342 | $256,900 | $135,500 | $121,400 |
| 2020 | $3,253 | $243,700 | $131,500 | $112,200 |
| 2019 | $3,267 | $237,600 | $125,200 | $112,400 |
| 2018 | $3,057 | $216,200 | $125,200 | $91,000 |
| 2017 | $2,933 | $216,200 | $125,200 | $91,000 |
| 2016 | $2,852 | $192,200 | $120,400 | $71,800 |
| 2015 | $2,932 | $196,400 | $120,400 | $76,000 |
| 2014 | $2,795 | $192,900 | $120,400 | $72,500 |
Source: Public Records
Map
Nearby Homes
- 54 Montaup Ave
- 1563 Bridge St
- 1573 Bridge St
- 1391 Bridge St
- 69 Arlington St
- 40 Arlington Ave
- 287 Fox Ave
- 26 Frank St
- 23 Frank St Unit 2
- 551 Hildreth St Unit 10
- 175 Willard St Unit 9
- 306 Aiken Ave Unit 16
- 700 Robbins Ave Unit 6
- 10 Lanseigne St
- 668 Robbins Ave Unit 1
- 315 Broadway Rd Unit 1
- 315 Broadway Rd Unit 7
- 417 Hildreth St Unit 30
- 367 Hildreth St Unit 14
- 345 Hildreth St Unit 14
Your Personal Tour Guide
Ask me questions while you tour the home.