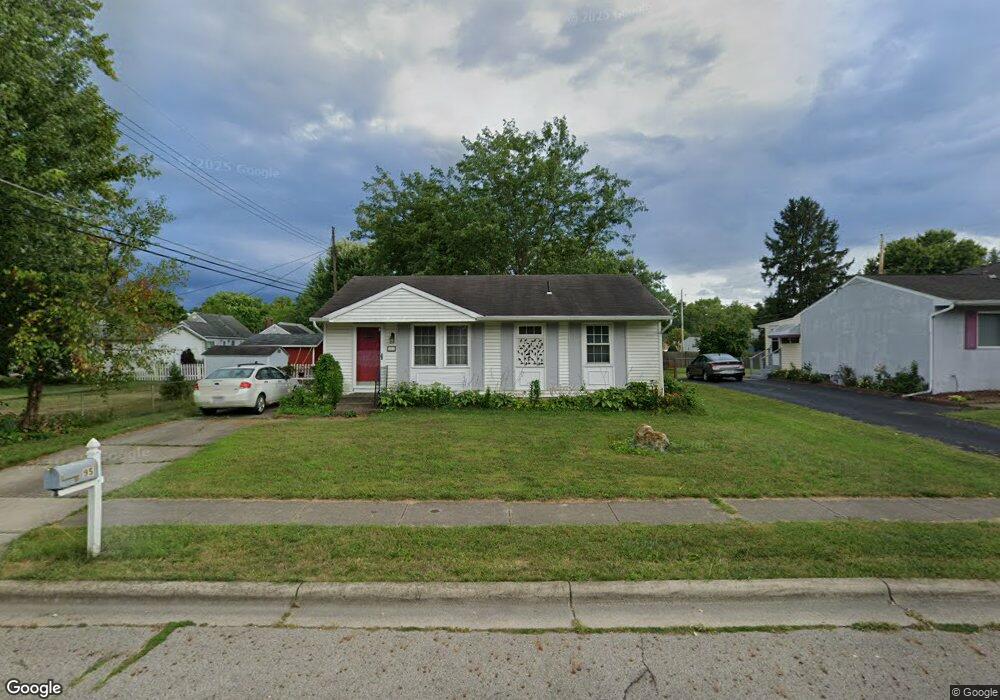
95 Cherry St Groveport, OH 43125
Estimated Value: $194,000 - $229,000
3
Beds
1
Bath
875
Sq Ft
$240/Sq Ft
Est. Value
About This Home
This home is located at 95 Cherry St, Groveport, OH 43125 and is currently estimated at $210,410, approximately $240 per square foot. 95 Cherry St is a home located in Franklin County with nearby schools including Groveport Madison High School, Groveport Community School, and Madison Christian School.
Ownership History
Date
Name
Owned For
Owner Type
Purchase Details
Closed on
Jun 18, 2003
Sold by
Huntley Douglas C
Bought by
Woods Kathleen M
Current Estimated Value
Home Financials for this Owner
Home Financials are based on the most recent Mortgage that was taken out on this home.
Original Mortgage
$86,714
Outstanding Balance
$36,936
Interest Rate
5.4%
Mortgage Type
Purchase Money Mortgage
Estimated Equity
$173,474
Purchase Details
Closed on
May 27, 2003
Sold by
Huntley Richard O and Huntley Iona M
Bought by
Huntley Douglas C
Home Financials for this Owner
Home Financials are based on the most recent Mortgage that was taken out on this home.
Original Mortgage
$86,714
Outstanding Balance
$36,936
Interest Rate
5.4%
Mortgage Type
Purchase Money Mortgage
Estimated Equity
$173,474
Purchase Details
Closed on
Apr 3, 1985
Bought by
Huntley Douglas C Et Al 3
Create a Home Valuation Report for This Property
The Home Valuation Report is an in-depth analysis detailing your home's value as well as a comparison with similar homes in the area
Home Values in the Area
Average Home Value in this Area
Purchase History
| Date | Buyer | Sale Price | Title Company |
|---|---|---|---|
| Woods Kathleen M | $87,400 | Amerititle Agency Inc | |
| Huntley Douglas C | -- | Amerititle Agency Inc | |
| Huntley Douglas C Et Al 3 | $43,800 | -- |
Source: Public Records
Mortgage History
| Date | Status | Borrower | Loan Amount |
|---|---|---|---|
| Open | Woods Kathleen M | $86,714 |
Source: Public Records
Tax History Compared to Growth
Tax History
| Year | Tax Paid | Tax Assessment Tax Assessment Total Assessment is a certain percentage of the fair market value that is determined by local assessors to be the total taxable value of land and additions on the property. | Land | Improvement |
|---|---|---|---|---|
| 2024 | $2,893 | $59,160 | $23,490 | $35,670 |
| 2023 | $2,868 | $59,150 | $23,485 | $35,665 |
| 2022 | $1,921 | $31,610 | $9,700 | $21,910 |
| 2021 | $1,928 | $31,610 | $9,700 | $21,910 |
| 2020 | $1,932 | $31,610 | $9,700 | $21,910 |
| 2019 | $1,831 | $26,400 | $8,090 | $18,310 |
| 2018 | $1,843 | $26,400 | $8,090 | $18,310 |
| 2017 | $1,845 | $26,400 | $8,090 | $18,310 |
| 2016 | $1,829 | $23,770 | $7,770 | $16,000 |
| 2015 | $1,845 | $23,770 | $7,770 | $16,000 |
| 2014 | $1,737 | $23,770 | $7,770 | $16,000 |
| 2013 | $780 | $25,025 | $8,190 | $16,835 |
Source: Public Records
Map
Nearby Homes