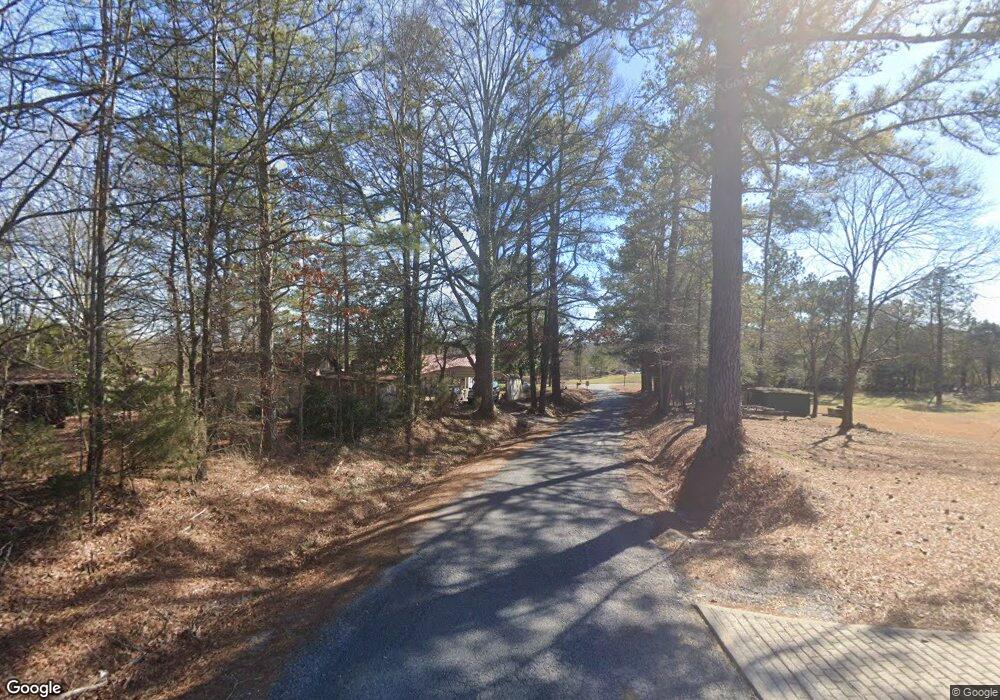
95 Corey Ln Aragon, GA 30104
Estimated Value: $198,000 - $254,000
3
Beds
2
Baths
1,285
Sq Ft
$177/Sq Ft
Est. Value
About This Home
This home is located at 95 Corey Ln, Aragon, GA 30104 and is currently estimated at $227,065, approximately $176 per square foot. 95 Corey Ln is a home with nearby schools including Rockmart Middle School.
Ownership History
Date
Name
Owned For
Owner Type
Purchase Details
Closed on
Aug 26, 2022
Sold by
Barfield Nathan E
Bought by
Barfield Ashley Deneen
Current Estimated Value
Purchase Details
Closed on
Mar 29, 2018
Sold by
Benefield Ashley Deneen
Bought by
Barfield Ashley Deneen and Barfield Nathan E
Home Financials for this Owner
Home Financials are based on the most recent Mortgage that was taken out on this home.
Original Mortgage
$72,750
Interest Rate
4.43%
Mortgage Type
New Conventional
Purchase Details
Closed on
Aug 7, 2007
Sold by
Not Provided
Bought by
Barfield Steven
Create a Home Valuation Report for This Property
The Home Valuation Report is an in-depth analysis detailing your home's value as well as a comparison with similar homes in the area
Home Values in the Area
Average Home Value in this Area
Purchase History
| Date | Buyer | Sale Price | Title Company |
|---|---|---|---|
| Barfield Ashley Deneen | -- | -- | |
| Barfield Ashley Deneen | -- | -- | |
| Barfield Ashley Deneen | $75,000 | -- | |
| Barfield Steven | $50,000 | -- |
Source: Public Records
Mortgage History
| Date | Status | Borrower | Loan Amount |
|---|---|---|---|
| Previous Owner | Barfield Ashley Deneen | $72,750 |
Source: Public Records
Tax History Compared to Growth
Tax History
| Year | Tax Paid | Tax Assessment Tax Assessment Total Assessment is a certain percentage of the fair market value that is determined by local assessors to be the total taxable value of land and additions on the property. | Land | Improvement |
|---|---|---|---|---|
| 2024 | $1,254 | $60,004 | $2,551 | $57,453 |
| 2023 | $961 | $40,486 | $2,551 | $37,935 |
| 2022 | $825 | $34,751 | $1,701 | $33,050 |
| 2021 | $835 | $34,751 | $1,701 | $33,050 |
| 2020 | $813 | $33,759 | $1,701 | $32,058 |
| 2019 | $884 | $32,932 | $1,701 | $31,231 |
| 2018 | $819 | $29,729 | $1,701 | $28,028 |
| 2017 | $809 | $29,729 | $1,701 | $28,028 |
| 2016 | $794 | $29,168 | $1,140 | $28,028 |
| 2015 | $799 | $29,291 | $1,140 | $28,151 |
| 2014 | $805 | $29,291 | $1,140 | $28,151 |
Source: Public Records
Map
Nearby Homes
- 4526 Rome Hwy
- 0 Hwy 101 and Dean Rd Unit 10620814
- 1424 Harmony Rd SE
- 838 Pleasant Hope Rd SE
- 6792 Rockmart Rd SE
- 34 Hudson Loop Rd
- 1111 Old Collard Valley Rd
- 231 Gordon Rd
- 320 Brumbelow Rd
- 330 Flint Hill Rd
- 463 Compton Rd SE
- 2557 Wax Rd SE
- 0 Stewart Rd
- 180 Flint Hill Rd
- 52 Lloyd Dr SE
- 150 Pleasant Hope Rd SE
- 110 Williams Rd SE
