Estimated Value: $458,000 - $566,000
4
Beds
2
Baths
1,600
Sq Ft
$319/Sq Ft
Est. Value
About This Home
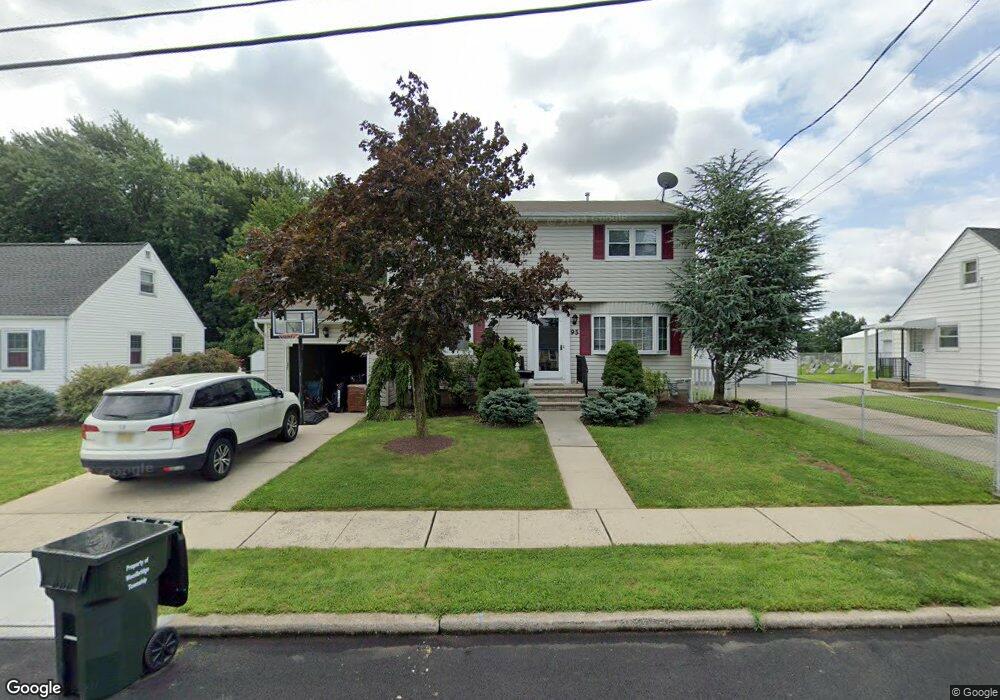
This home is located at 95 Corey St, Fords, NJ 08863 and is currently estimated at $510,258, approximately $318 per square foot. 95 Corey St is a home located in Middlesex County with nearby schools including Menlo Park Terrace School, Fords Middle School, and Woodbridge High School.
Ownership History
Date
Name
Owned For
Owner Type
Purchase Details
Closed on
Mar 22, 2018
Sold by
Cizewski James and Cizewski Phyllis
Bought by
Olivero Anthony and Olivero Jordan
Current Estimated Value
Home Financials for this Owner
Home Financials are based on the most recent Mortgage that was taken out on this home.
Original Mortgage
$277,400
Outstanding Balance
$237,822
Interest Rate
4.4%
Mortgage Type
New Conventional
Estimated Equity
$272,436
Purchase Details
Closed on
Jul 17, 1978
Bought by
Ciszewski James and Ciszewski Phyllis
Create a Home Valuation Report for This Property
The Home Valuation Report is an in-depth analysis detailing your home's value as well as a comparison with similar homes in the area
Home Values in the Area
Average Home Value in this Area
Purchase History
| Date | Buyer | Sale Price | Title Company |
|---|---|---|---|
| Olivero Anthony | $292,000 | Attorney Title Services Llc | |
| Ciszewski James | $57,000 | -- |
Source: Public Records
Mortgage History
| Date | Status | Borrower | Loan Amount |
|---|---|---|---|
| Open | Olivero Anthony | $277,400 |
Source: Public Records
Tax History
| Year | Tax Paid | Tax Assessment Tax Assessment Total Assessment is a certain percentage of the fair market value that is determined by local assessors to be the total taxable value of land and additions on the property. | Land | Improvement |
|---|---|---|---|---|
| 2025 | $11,166 | $88,000 | $25,100 | $62,900 |
| 2024 | $10,886 | $88,000 | $25,100 | $62,900 |
Source: Public Records
Map
Nearby Homes
- 1 Olive St
- 142 Liberty St
- 179 Liberty St
- 12 Liberty St
- 163 Winchester Rd
- 450 Crows Mill Rd
- 21 Douglas St
- 12 E William St
- 636 King Georges Rd
- 3 Lillian St
- 17 Clembil Ct
- 130 Loretta St
- 808 King Georges Rd
- 16 Emmett Ave
- 101 Saint Stephens Ave
- 131 Fairfield Ave
- 40 Ling St
- 6 Worden Ave
- 40 S Grove Ave
- 49 Loretta St
Your Personal Tour Guide
Ask me questions while you tour the home.