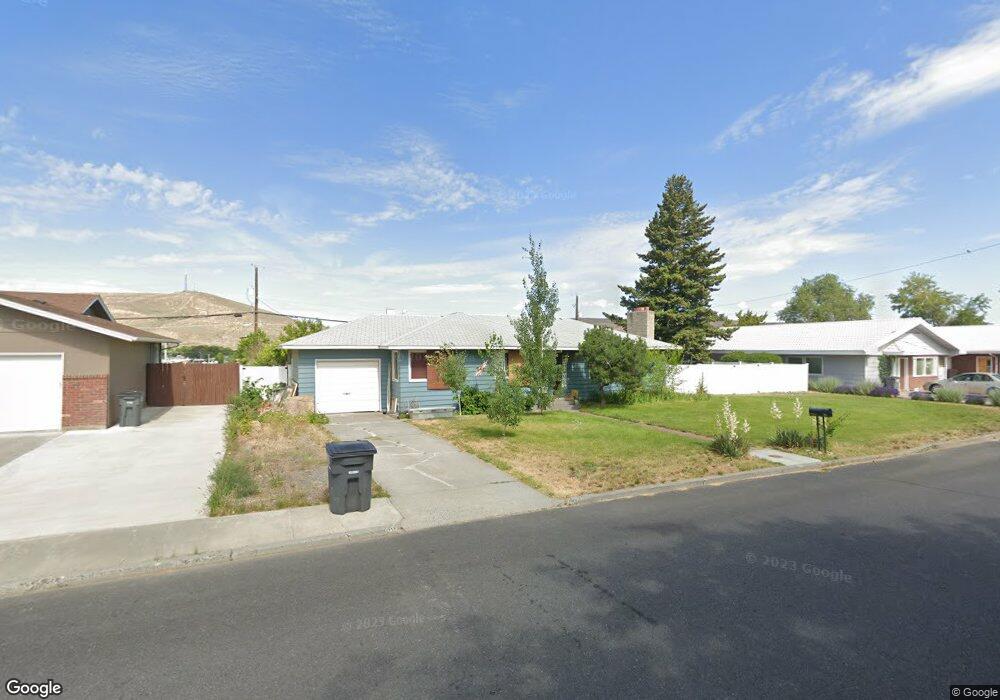
95 Crest Dr Ephrata, WA 98823
Estimated Value: $276,000 - $391,000
4
Beds
2
Baths
1,302
Sq Ft
$247/Sq Ft
Est. Value
About This Home
This home is located at 95 Crest Dr, Ephrata, WA 98823 and is currently estimated at $320,983, approximately $246 per square foot. 95 Crest Dr is a home located in Grant County with nearby schools including Ephrata High School, New Life Christian School, and St. Rose of Lima Catholic School.
Ownership History
Date
Name
Owned For
Owner Type
Purchase Details
Closed on
Aug 16, 2025
Sold by
Moser Ian
Bought by
Bridges Randalyn
Current Estimated Value
Purchase Details
Closed on
Jun 24, 2021
Sold by
Gfe Johnson Llc
Bought by
Moser Randalyn R and Moser Ian I
Home Financials for this Owner
Home Financials are based on the most recent Mortgage that was taken out on this home.
Original Mortgage
$239,580
Interest Rate
2.9%
Mortgage Type
New Conventional
Purchase Details
Closed on
Jan 3, 2019
Sold by
Frazier Jean K and Frazier Larry R
Bought by
Gfe Johnson Llc
Purchase Details
Closed on
Jul 28, 2016
Sold by
Rashford Dorothy
Bought by
Frazier Jean K and Frazier Larry R
Create a Home Valuation Report for This Property
The Home Valuation Report is an in-depth analysis detailing your home's value as well as a comparison with similar homes in the area
Home Values in the Area
Average Home Value in this Area
Purchase History
| Date | Buyer | Sale Price | Title Company |
|---|---|---|---|
| Bridges Randalyn | -- | None Listed On Document | |
| Moser Randalyn R | $266,200 | Frontier Title And Escrow Co | |
| Gfe Johnson Llc | $110,000 | Stewart Title | |
| Frazier Jean K | -- | None Available |
Source: Public Records
Mortgage History
| Date | Status | Borrower | Loan Amount |
|---|---|---|---|
| Previous Owner | Moser Randalyn R | $239,580 |
Source: Public Records
Tax History Compared to Growth
Tax History
| Year | Tax Paid | Tax Assessment Tax Assessment Total Assessment is a certain percentage of the fair market value that is determined by local assessors to be the total taxable value of land and additions on the property. | Land | Improvement |
|---|---|---|---|---|
| 2024 | $2,124 | $188,110 | $39,500 | $148,610 |
| 2023 | $2,259 | $180,185 | $39,500 | $140,685 |
| 2022 | $2,246 | $180,185 | $39,500 | $140,685 |
| 2021 | $2,060 | $180,185 | $39,500 | $140,685 |
| 2020 | $1,976 | $157,415 | $39,500 | $117,915 |
| 2019 | $1,494 | $140,570 | $39,500 | $101,070 |
| 2018 | $1,992 | $137,505 | $34,000 | $103,505 |
| 2017 | $1,915 | $141,070 | $34,000 | $107,070 |
| 2016 | $141 | $130,705 | $34,000 | $96,705 |
| 2013 | -- | $134,910 | $34,000 | $100,910 |
Source: Public Records
Map
Nearby Homes