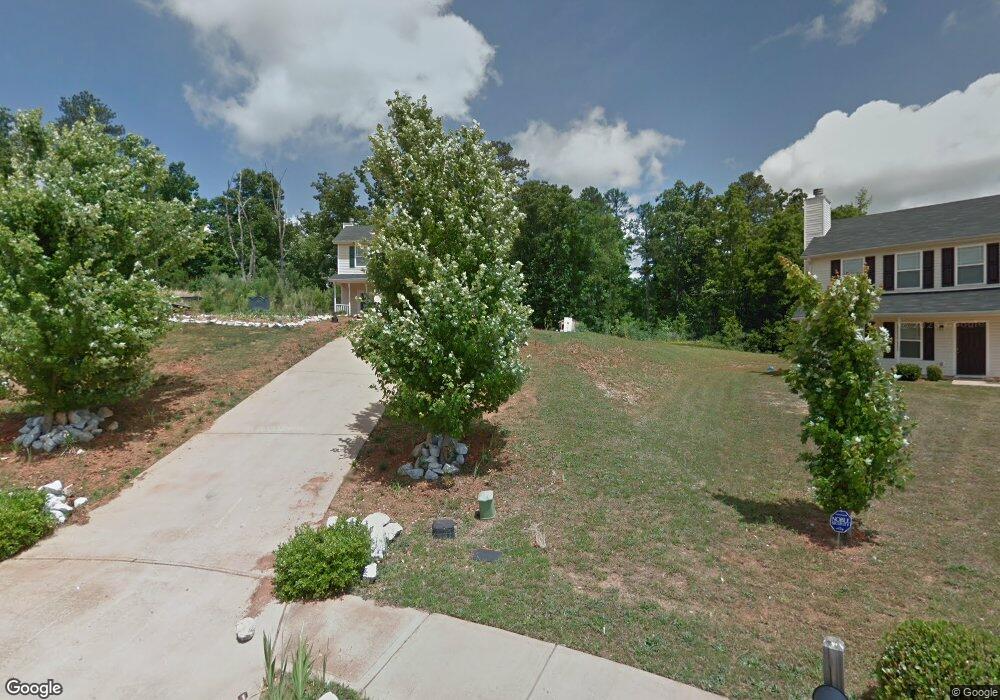
95 Dayton Way Covington, GA 30016
Estimated Value: $273,141 - $298,000
4
Beds
3
Baths
1,847
Sq Ft
$154/Sq Ft
Est. Value
About This Home
This home is located at 95 Dayton Way, Covington, GA 30016 and is currently estimated at $284,785, approximately $154 per square foot. 95 Dayton Way is a home located in Newton County with nearby schools including South Salem Elementary School, Liberty Middle School, and Alcovy High School.
Ownership History
Date
Name
Owned For
Owner Type
Purchase Details
Closed on
Mar 12, 2024
Sold by
Pettway Vickie H
Bought by
Little Kevin
Current Estimated Value
Purchase Details
Closed on
Oct 9, 2018
Sold by
Hinson Thomasine
Bought by
Pettway Vickie H
Purchase Details
Closed on
Mar 20, 2018
Sold by
Little Kevin
Bought by
Hinson Thomasine
Purchase Details
Closed on
Mar 2, 2012
Sold by
Federal National Mortgage Association
Bought by
Little Kevin T
Purchase Details
Closed on
Nov 1, 2011
Sold by
Bank Of America Na
Bought by
Federal National Mtg Associati
Purchase Details
Closed on
Sep 1, 2005
Sold by
B Kay Bldrs Corp
Bought by
Clay Robertson Inc
Home Financials for this Owner
Home Financials are based on the most recent Mortgage that was taken out on this home.
Original Mortgage
$220,500
Interest Rate
5.64%
Mortgage Type
New Conventional
Create a Home Valuation Report for This Property
The Home Valuation Report is an in-depth analysis detailing your home's value as well as a comparison with similar homes in the area
Home Values in the Area
Average Home Value in this Area
Purchase History
| Date | Buyer | Sale Price | Title Company |
|---|---|---|---|
| Little Kevin | -- | -- | |
| Pettway Vickie H | -- | -- | |
| Hinson Thomasine | -- | -- | |
| Little Kevin T | $40,000 | -- | |
| Federal National Mtg Associati | $124,073 | -- | |
| Bank Of America Na | $124,073 | -- | |
| Clay Robertson Inc | $245,000 | -- |
Source: Public Records
Mortgage History
| Date | Status | Borrower | Loan Amount |
|---|---|---|---|
| Previous Owner | Clay Robertson Inc | $220,500 |
Source: Public Records
Tax History Compared to Growth
Tax History
| Year | Tax Paid | Tax Assessment Tax Assessment Total Assessment is a certain percentage of the fair market value that is determined by local assessors to be the total taxable value of land and additions on the property. | Land | Improvement |
|---|---|---|---|---|
| 2024 | $3,352 | $129,760 | $15,200 | $114,560 |
| 2023 | $3,145 | $113,480 | $5,600 | $107,880 |
| 2022 | $2,395 | $85,840 | $5,600 | $80,240 |
| 2021 | $2,438 | $78,240 | $5,600 | $72,640 |
| 2020 | $2,151 | $62,120 | $5,600 | $56,520 |
| 2019 | $1,956 | $55,480 | $5,600 | $49,880 |
| 2018 | $1,244 | $38,280 | $5,000 | $33,280 |
| 2017 | $1,314 | $40,320 | $5,000 | $35,320 |
| 2016 | $1,199 | $36,960 | $5,000 | $31,960 |
| 2015 | $1,192 | $32,880 | $3,000 | $29,880 |
| 2014 | $1,065 | $29,280 | $0 | $0 |
Source: Public Records
Map
Nearby Homes
- 711 Highway 162
- 195 Twin Lakes Dr
- 110 Twin Lakes Dr
- 331 Highway 162
- 55 Twin Lakes Dr
- 215 Morningside Dr
- 910 Georgia 162
- 0 Roseberry Rd
- 102 Tempie Ln
- 0 Tempie Ln
- 230 Lynn Dr
- 0 Eleanor Dr Unit 10443925
- 0 Lower River Rd Unit 10461341
- 940 Mote Rd
- 5798 Salem Rd
- 140 Sunflower Ln
- 85 Lakeside Dr
- 65 Heaton Place Trail
- 85 Dayton Way
- 110 Dayton Way
- 75 Dayton Way Unit 75
- 75 Dayton Way
- 100 Dayton Way
- 599 Highway 162
- 583 Highway 162
- 615 Highway 162
- 615 Georgia 162
- 80 Dayton Way
- 65 Dayton Way
- 65 Dayton Way
- 90 Dayton Way
- 565 Georgia 162
- 565 Highway 162
- 547 Highway 162
- 70 Dayton Way
- 60 Dayton Way
- 503 Highway 162
- 653 Highway 162