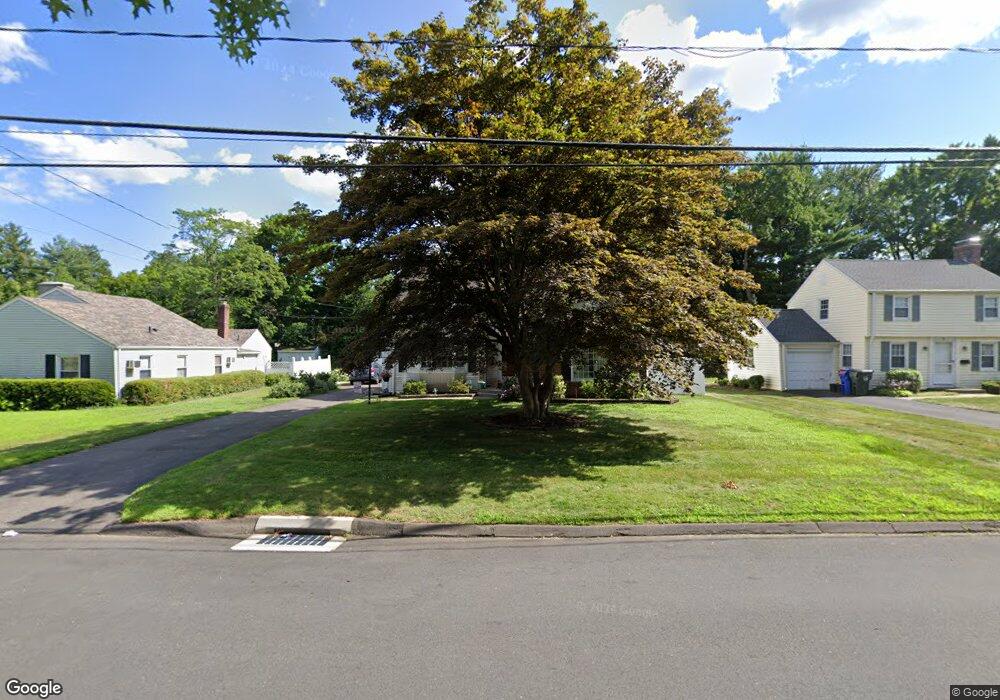
95 Dowd St Newington, CT 06111
Estimated Value: $405,175 - $459,000
3
Beds
2
Baths
2,067
Sq Ft
$213/Sq Ft
Est. Value
About This Home
This home is located at 95 Dowd St, Newington, CT 06111 and is currently estimated at $440,044, approximately $212 per square foot. 95 Dowd St is a home located in Hartford County with nearby schools including Anna Reynolds School, Martin Kellogg Middle School, and Newington High School.
Ownership History
Date
Name
Owned For
Owner Type
Purchase Details
Closed on
Jul 2, 2009
Sold by
Pace Marco and Pace Maria E
Bought by
Discher Eric J and Discher Lisa A
Current Estimated Value
Home Financials for this Owner
Home Financials are based on the most recent Mortgage that was taken out on this home.
Original Mortgage
$288,674
Outstanding Balance
$183,272
Interest Rate
4.86%
Estimated Equity
$256,772
Purchase Details
Closed on
Oct 26, 1999
Sold by
Shaw David M and Shaw Eileen
Bought by
Pace Marco and Pace Maria E
Home Financials for this Owner
Home Financials are based on the most recent Mortgage that was taken out on this home.
Original Mortgage
$159,550
Interest Rate
7.83%
Purchase Details
Closed on
Oct 1, 1993
Sold by
Peterson Janet S
Bought by
Shaw David M and Shaw Eileen
Home Financials for this Owner
Home Financials are based on the most recent Mortgage that was taken out on this home.
Original Mortgage
$133,950
Interest Rate
7%
Mortgage Type
Unknown
Create a Home Valuation Report for This Property
The Home Valuation Report is an in-depth analysis detailing your home's value as well as a comparison with similar homes in the area
Home Values in the Area
Average Home Value in this Area
Purchase History
| Date | Buyer | Sale Price | Title Company |
|---|---|---|---|
| Discher Eric J | $294,000 | -- | |
| Pace Marco | $177,312 | -- | |
| Shaw David M | $141,000 | -- |
Source: Public Records
Mortgage History
| Date | Status | Borrower | Loan Amount |
|---|---|---|---|
| Open | Shaw David M | $288,674 | |
| Previous Owner | Shaw David M | $156,000 | |
| Previous Owner | Shaw David M | $159,550 | |
| Previous Owner | Shaw David M | $133,950 |
Source: Public Records
Tax History Compared to Growth
Tax History
| Year | Tax Paid | Tax Assessment Tax Assessment Total Assessment is a certain percentage of the fair market value that is determined by local assessors to be the total taxable value of land and additions on the property. | Land | Improvement |
|---|---|---|---|---|
| 2025 | $7,093 | $177,420 | $55,440 | $121,980 |
| 2024 | $7,038 | $177,420 | $55,440 | $121,980 |
| 2023 | $6,806 | $177,420 | $55,440 | $121,980 |
| 2022 | $6,737 | $175,030 | $55,440 | $119,590 |
| 2021 | $6,793 | $175,030 | $55,440 | $119,590 |
| 2020 | $6,680 | $170,050 | $51,980 | $118,070 |
| 2019 | $6,708 | $170,050 | $51,980 | $118,070 |
| 2018 | $6,547 | $170,050 | $51,980 | $118,070 |
| 2017 | $6,222 | $170,050 | $51,980 | $118,070 |
| 2016 | $6,079 | $170,050 | $51,980 | $118,070 |
| 2014 | $6,110 | $175,740 | $52,190 | $123,550 |
Source: Public Records
Map
Nearby Homes
- 105 Gilbert Rd
- 57 Welles Dr
- 846 Main St
- 35 Harding Ave
- 27 Harding Ave
- 73 Camp Ave
- 193 Connecticut Ave
- 140 Camp Ave
- 36 Hartt Ln
- 760 Willard Ave
- 66 Rosemary Ln Unit 66
- 9 Old Farm Dr
- 7 Old Farm Dr
- 19 Saddle Hill Cir
- 377 Connecticut Ave
- 37 Commonwealth Ave
- 47 Francis Dr
- 70 Cedar Ridge Rd
- 193 Hillcrest Ave
- 236 Old Farm Dr