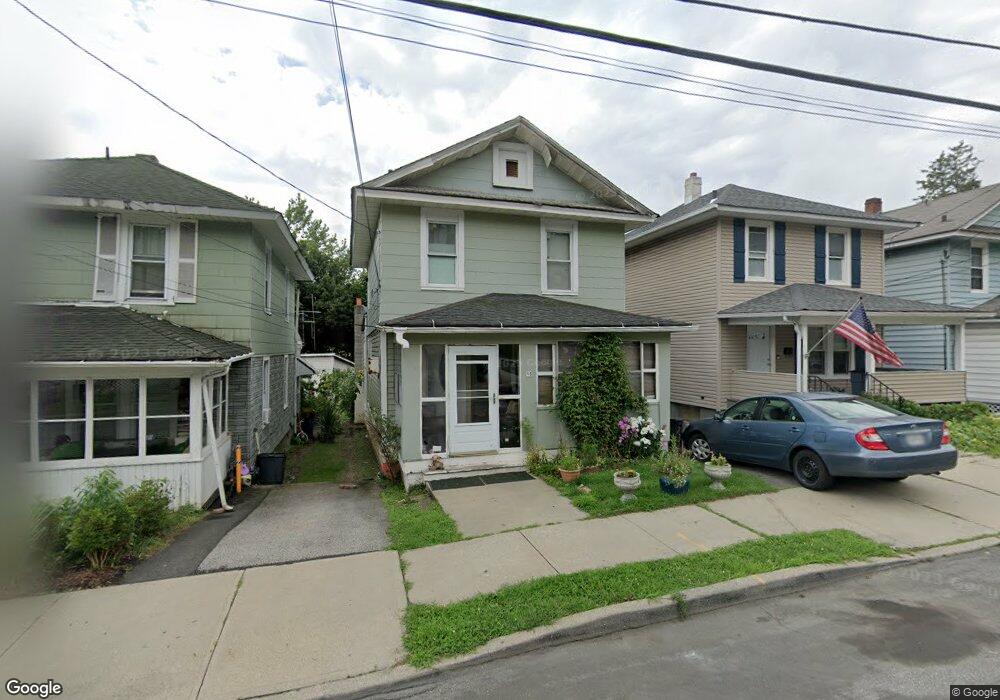
95 Dupont Ave Newburgh, NY 12550
Estimated Value: $302,000 - $498,000
4
Beds
2
Baths
1,780
Sq Ft
$213/Sq Ft
Est. Value
About This Home
This home is located at 95 Dupont Ave, Newburgh, NY 12550 and is currently estimated at $379,456, approximately $213 per square foot. 95 Dupont Ave is a home located in Orange County with nearby schools including Newburgh Free Academy Main Campus, Bishop Dunn Memorial, and San Miguel Academy Of Newburgh.
Ownership History
Date
Name
Owned For
Owner Type
Purchase Details
Closed on
Nov 24, 2003
Sold by
Dean Nanley Kay
Bought by
Newburgh Commercial Development Corp
Current Estimated Value
Purchase Details
Closed on
Jun 17, 2003
Sold by
Ruiz Glenda
Bought by
Braan Yessy
Purchase Details
Closed on
Aug 8, 2000
Sold by
Dean Nanley Kay and Raulerson Nanley Kay
Bought by
Ruiz Glenda and Rozales Gladys
Home Financials for this Owner
Home Financials are based on the most recent Mortgage that was taken out on this home.
Original Mortgage
$97,188
Interest Rate
8.06%
Mortgage Type
FHA
Create a Home Valuation Report for This Property
The Home Valuation Report is an in-depth analysis detailing your home's value as well as a comparison with similar homes in the area
Home Values in the Area
Average Home Value in this Area
Purchase History
| Date | Buyer | Sale Price | Title Company |
|---|---|---|---|
| Newburgh Commercial Development Corp | $4,000 | Frank Healey | |
| Braan Yessy | $168,700 | Thomas Murphy | |
| Ruiz Glenda | $98,000 | -- |
Source: Public Records
Mortgage History
| Date | Status | Borrower | Loan Amount |
|---|---|---|---|
| Previous Owner | Ruiz Glenda | $97,188 |
Source: Public Records
Tax History Compared to Growth
Tax History
| Year | Tax Paid | Tax Assessment Tax Assessment Total Assessment is a certain percentage of the fair market value that is determined by local assessors to be the total taxable value of land and additions on the property. | Land | Improvement |
|---|---|---|---|---|
| 2024 | $8,098 | $264,600 | $25,800 | $238,800 |
| 2023 | $8,098 | $245,000 | $25,800 | $219,200 |
| 2022 | $8,845 | $207,000 | $12,200 | $194,800 |
| 2021 | $8,047 | $172,500 | $11,100 | $161,400 |
| 2020 | $7,648 | $150,000 | $11,100 | $138,900 |
| 2019 | $3,165 | $134,800 | $11,100 | $123,700 |
| 2018 | $3,165 | $134,800 | $12,100 | $122,700 |
| 2017 | $5,879 | $134,800 | $12,100 | $122,700 |
| 2016 | $8,167 | $129,200 | $12,100 | $117,100 |
| 2015 | -- | $129,200 | $12,100 | $117,100 |
| 2014 | -- | $129,200 | $12,100 | $117,100 |
Source: Public Records
Map
Nearby Homes