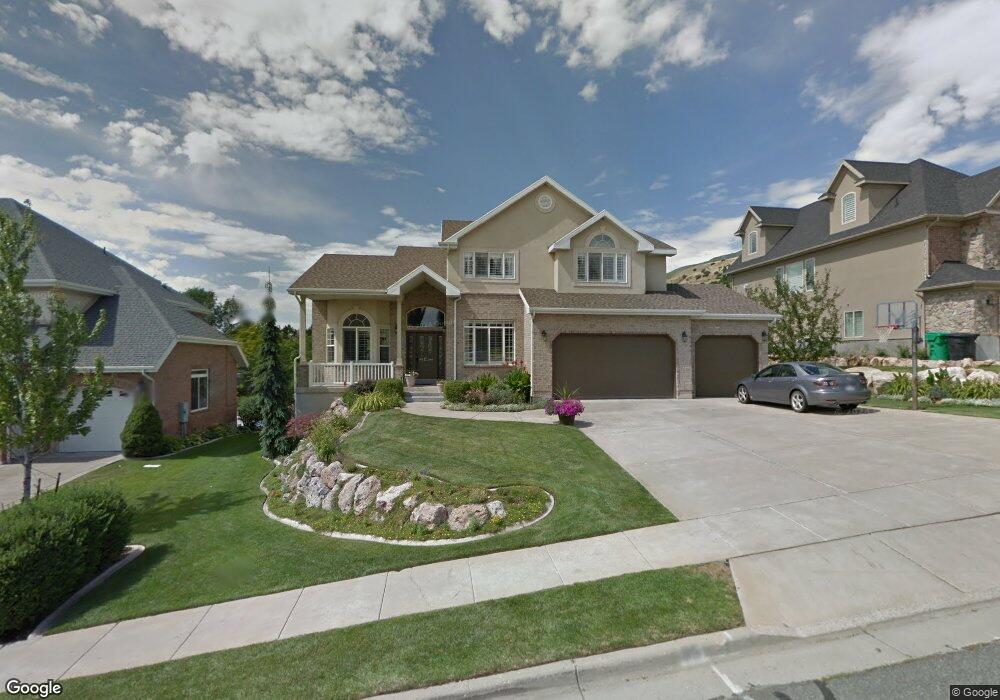
95 E 1900 N Centerville, UT 84014
Estimated Value: $875,000 - $1,002,000
4
Beds
3
Baths
4,182
Sq Ft
$223/Sq Ft
Est. Value
About This Home
This home is located at 95 E 1900 N, Centerville, UT 84014 and is currently estimated at $934,375, approximately $223 per square foot. 95 E 1900 N is a home located in Davis County with nearby schools including Reading School, Centerville Jr High, and Viewmont High School.
Ownership History
Date
Name
Owned For
Owner Type
Purchase Details
Closed on
Jul 22, 2014
Sold by
Wade Tammy S
Bought by
Holman Jeffrey T and Holman Brooke B
Current Estimated Value
Home Financials for this Owner
Home Financials are based on the most recent Mortgage that was taken out on this home.
Original Mortgage
$81,800
Outstanding Balance
$62,307
Interest Rate
4.16%
Mortgage Type
Credit Line Revolving
Estimated Equity
$872,068
Purchase Details
Closed on
Nov 11, 2004
Sold by
Wade Blake Knight and Wade Tammy S
Bought by
Wade Tammy S
Purchase Details
Closed on
May 10, 2004
Sold by
Wade Blake K and Wade Tammy S
Bought by
Wade Tammy S
Purchase Details
Closed on
Nov 17, 1998
Sold by
Dunn D Kim and Dunn Connie
Bought by
Wade Blake Knight and Wade Tamara S
Home Financials for this Owner
Home Financials are based on the most recent Mortgage that was taken out on this home.
Original Mortgage
$227,150
Interest Rate
6.07%
Create a Home Valuation Report for This Property
The Home Valuation Report is an in-depth analysis detailing your home's value as well as a comparison with similar homes in the area
Purchase History
| Date | Buyer | Sale Price | Title Company |
|---|---|---|---|
| Holman Jeffrey T | -- | Inwest Title Servic | |
| Wade Tammy S | -- | -- | |
| Wade Tammy S | -- | -- | |
| Wade Blake Knight | -- | Associated Title Company |
Source: Public Records
Mortgage History
| Date | Status | Borrower | Loan Amount |
|---|---|---|---|
| Open | Holman Jeffrey T | $81,800 | |
| Open | Holman Jeffrey T | $411,750 | |
| Previous Owner | Wade Blake Knight | $227,150 |
Source: Public Records
Tax History
| Year | Tax Paid | Tax Assessment Tax Assessment Total Assessment is a certain percentage of the fair market value that is determined by local assessors to be the total taxable value of land and additions on the property. | Land | Improvement |
|---|---|---|---|---|
| 2025 | $5,353 | $474,650 | $200,455 | $274,195 |
| 2024 | $5,016 | $454,850 | $190,228 | $264,622 |
| 2023 | $4,833 | $798,000 | $298,770 | $499,230 |
| 2022 | $4,931 | $450,450 | $153,532 | $296,918 |
| 2021 | $4,497 | $638,000 | $249,825 | $388,175 |
| 2020 | $4,049 | $572,000 | $236,062 | $335,938 |
| 2019 | $3,947 | $547,000 | $222,252 | $324,748 |
| 2018 | $3,772 | $519,000 | $204,869 | $314,131 |
| 2016 | $3,213 | $247,556 | $84,244 | $163,312 |
| 2015 | $2,942 | $214,776 | $84,244 | $130,532 |
| 2014 | $2,495 | $186,787 | $84,244 | $102,543 |
| 2013 | -- | $221,354 | $58,017 | $163,337 |
Source: Public Records
Map
Nearby Homes
- 1893 N 100 E
- 63 W 1750 N
- 5 W Summerhill Ln
- 136 W Summerhill Ln
- 283 W Summerhill Ln
- 286 W Summerhill Ln
- 586 W 1950 N
- 354 S 525 W
- 393 S 525 W
- 374 S 525 W
- 373 S 525 W
- 386 S 525 W
- 461 W Summerhill Ln
- 551 W Summerhill Ln
- 687 W 2025 N
- 145 Ford Canyon Dr
- 1549 N 400 W
- 2132 N 725 W
- 2136 N 725 W
- 1692 Willow Creek Cir
Your Personal Tour Guide
Ask me questions while you tour the home.