Estimated Value: $531,000 - $1,609,238
3
Beds
1
Bath
892
Sq Ft
$1,200/Sq Ft
Est. Value
About This Home
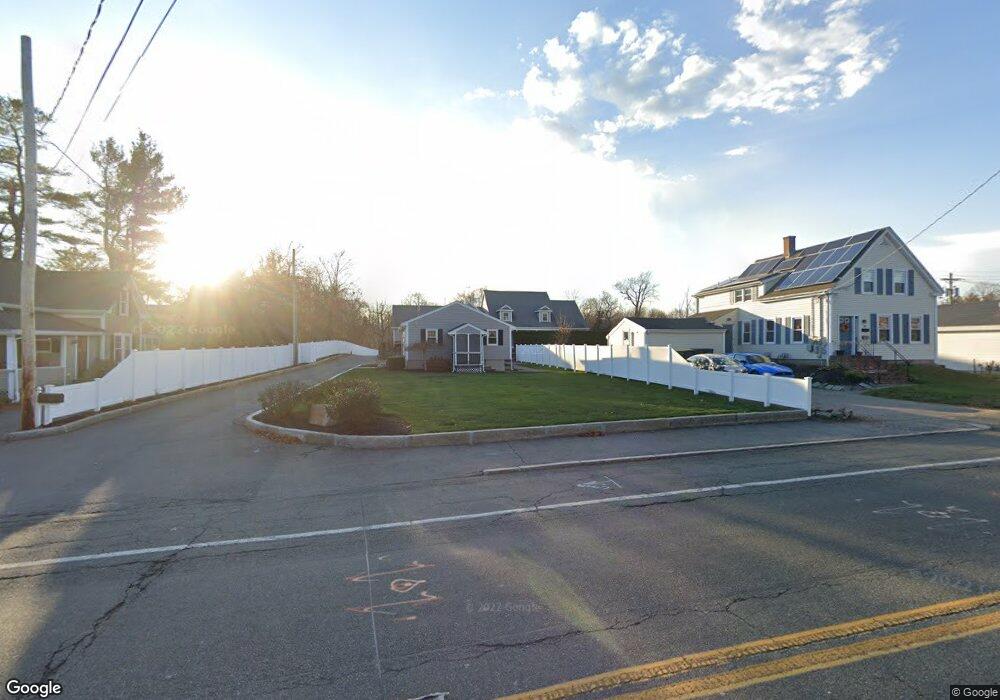
This home is located at 95 E Main St, Avon, MA 02322 and is currently estimated at $1,070,119, approximately $1,199 per square foot. 95 E Main St is a home located in Norfolk County with nearby schools including Ralph D. Butler Elementary School and Avon Middle/High School.
Ownership History
Date
Name
Owned For
Owner Type
Purchase Details
Closed on
Oct 25, 2020
Sold by
Jla Properties Llc
Bought by
Nye John
Current Estimated Value
Purchase Details
Closed on
Oct 14, 2005
Sold by
Gesner Charlotte F and Gesner Michael W
Bought by
Nye John
Home Financials for this Owner
Home Financials are based on the most recent Mortgage that was taken out on this home.
Original Mortgage
$244,000
Interest Rate
5.78%
Mortgage Type
Purchase Money Mortgage
Create a Home Valuation Report for This Property
The Home Valuation Report is an in-depth analysis detailing your home's value as well as a comparison with similar homes in the area
Home Values in the Area
Average Home Value in this Area
Purchase History
| Date | Buyer | Sale Price | Title Company |
|---|---|---|---|
| Nye John | -- | None Available | |
| Nye John | $305,000 | -- |
Source: Public Records
Mortgage History
| Date | Status | Borrower | Loan Amount |
|---|---|---|---|
| Previous Owner | Nye John | $244,000 |
Source: Public Records
Tax History
| Year | Tax Paid | Tax Assessment Tax Assessment Total Assessment is a certain percentage of the fair market value that is determined by local assessors to be the total taxable value of land and additions on the property. | Land | Improvement |
|---|---|---|---|---|
| 2025 | $22,994 | $1,723,700 | $382,900 | $1,340,800 |
| 2024 | $21,933 | $1,563,300 | $382,900 | $1,180,400 |
| 2023 | $21,292 | $1,563,300 | $382,900 | $1,180,400 |
| 2022 | $23,617 | $1,493,800 | $374,000 | $1,119,800 |
| 2021 | $17,438 | $1,039,200 | $183,500 | $855,700 |
| 2020 | $18,171 | $1,026,600 | $183,500 | $843,100 |
| 2019 | $17,465 | $970,800 | $183,500 | $787,300 |
| 2018 | $16,489 | $888,900 | $115,400 | $773,500 |
| 2017 | $12,754 | $738,100 | $115,400 | $622,700 |
| 2016 | $13,313 | $778,100 | $118,800 | $659,300 |
| 2015 | $12,289 | $750,700 | $118,800 | $631,900 |
Source: Public Records
Map
Nearby Homes
Your Personal Tour Guide
Ask me questions while you tour the home.