Estimated Value: $690,000 - $1,514,383
About This Home
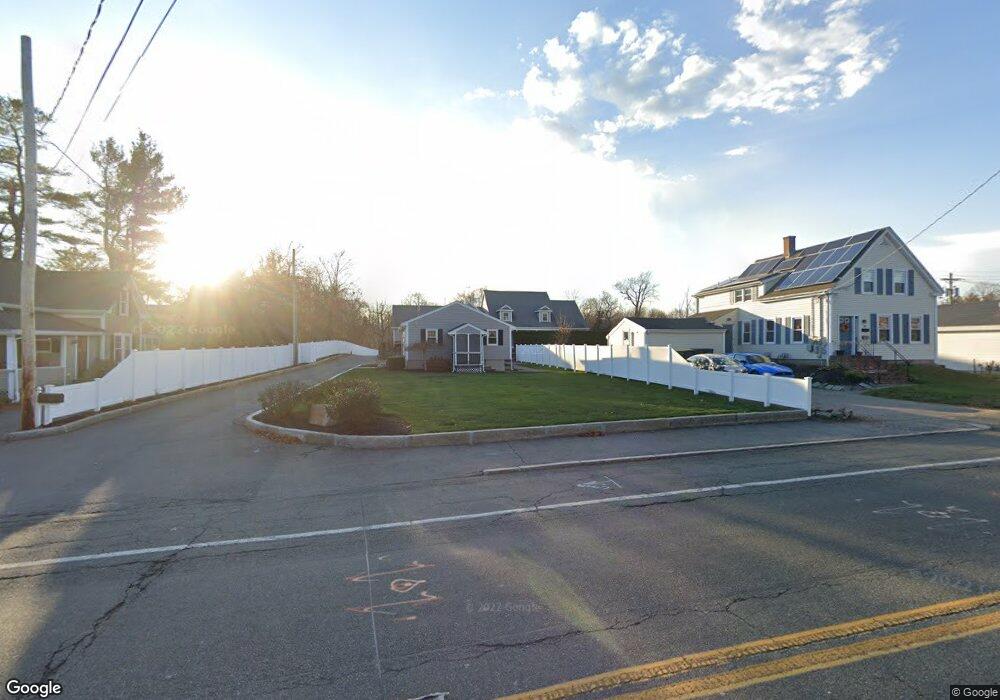
This home is located at 95 E Main St, Avon, MA 02322 and is currently estimated at $1,102,192, approximately $1,235 per square foot. 95 E Main St is a home located in Norfolk County with nearby schools including Ralph D. Butler Elementary School and Avon Middle/High School.
Ownership History
We collect this data history from publicly available records. To have your information removed, we recommend requesting removal directly through your county’s website.
Purchase Details
Purchase Details
Home Financials for this Owner
Home Financials are based on the most recent Mortgage that was taken out on this home.Home Values in the Area
Average Home Value in this Area
Purchase History
We collect this data history from publicly available records. To have your information removed, we recommend requesting removal directly through your county’s website.
| Date | Buyer | Sale Price | Title Company |
|---|---|---|---|
| -- | None Available | ||
| $305,000 | -- |
Mortgage History
We collect this data history from publicly available records. To have your information removed, we recommend requesting removal directly through your county’s website.
| Date | Status | Borrower | Loan Amount |
|---|---|---|---|
| Previous Owner | $244,000 |
Tax History
We collect this data history from publicly available records. To have your information removed, we recommend requesting removal directly through your county’s website.
| Year | Tax Paid | Tax Assessment Tax Assessment Total Assessment is a certain percentage of the fair market value that is determined by local assessors to be the total taxable value of land and additions on the property. | Land | Improvement |
|---|---|---|---|---|
| 2025 | $22,994 | $1,723,700 | $382,900 | $1,340,800 |
| 2024 | $21,933 | $1,563,300 | $382,900 | $1,180,400 |
| 2023 | $21,292 | $1,563,300 | $382,900 | $1,180,400 |
| 2022 | $23,617 | $1,493,800 | $374,000 | $1,119,800 |
| 2021 | $17,438 | $1,039,200 | $183,500 | $855,700 |
| 2020 | $18,171 | $1,026,600 | $183,500 | $843,100 |
| 2019 | $17,465 | $970,800 | $183,500 | $787,300 |
| 2018 | $16,489 | $888,900 | $115,400 | $773,500 |
| 2017 | $12,754 | $738,100 | $115,400 | $622,700 |
| 2016 | $13,313 | $778,100 | $118,800 | $659,300 |
| 2015 | $12,289 | $750,700 | $118,800 | $631,900 |
Map
- 196 E Main St Unit C
- 71 W Spring St
- 192 E Spring St
- 85 Malley Ave
- 150 E High St
- 747 S Main St
- 447 E Main St
- 478 E Main St
- 66 Frederickson Dr
- 14 Leonard Ln
- 456 South St
- 125 Burkeside Ave
- 10 N Glenway Ave
- 6 Sunnyside Ave
- 499 South St
- 36 Kalmia Rd
- 10 Toscano Way Unit 10
- 21 Sutton St
- 24 Toscano Way Unit 24
- 18 Toscano Way Unit 18
Ask me questions while you tour the home.