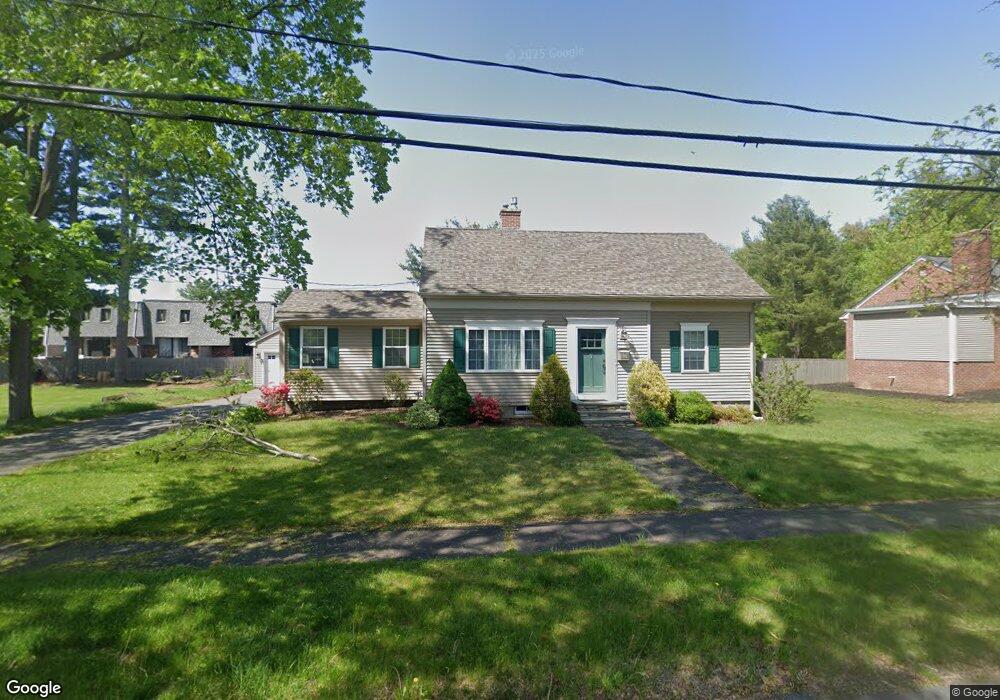
95 Edward St Agawam, MA 01001
Estimated Value: $398,000 - $499,000
3
Beds
2
Baths
1,888
Sq Ft
$230/Sq Ft
Est. Value
About This Home
This home is located at 95 Edward St, Agawam, MA 01001 and is currently estimated at $434,535, approximately $230 per square foot. 95 Edward St is a home located in Hampden County with nearby schools including Agawam Junior High School, Agawam High School, and St Thomas The Apostle School.
Ownership History
Date
Name
Owned For
Owner Type
Purchase Details
Closed on
Sep 29, 2015
Sold by
Voltz Richard L and Voltz Betty
Bought by
Saloio Anthony D and Gessay Gina M
Current Estimated Value
Home Financials for this Owner
Home Financials are based on the most recent Mortgage that was taken out on this home.
Original Mortgage
$255,000
Outstanding Balance
$201,242
Interest Rate
3.97%
Mortgage Type
New Conventional
Estimated Equity
$233,293
Purchase Details
Closed on
Apr 9, 2013
Sold by
Voltz Betty
Bought by
Voltz Betty and Voltz Richard L
Purchase Details
Closed on
Apr 13, 2009
Sold by
Cobb Robert L
Bought by
Voltz Betty and Cobb Robert L
Create a Home Valuation Report for This Property
The Home Valuation Report is an in-depth analysis detailing your home's value as well as a comparison with similar homes in the area
Home Values in the Area
Average Home Value in this Area
Purchase History
| Date | Buyer | Sale Price | Title Company |
|---|---|---|---|
| Saloio Anthony D | $275,000 | -- | |
| Voltz Betty | -- | -- | |
| Voltz Betty | -- | -- |
Source: Public Records
Mortgage History
| Date | Status | Borrower | Loan Amount |
|---|---|---|---|
| Open | Saloio Anthony D | $255,000 |
Source: Public Records
Tax History
| Year | Tax Paid | Tax Assessment Tax Assessment Total Assessment is a certain percentage of the fair market value that is determined by local assessors to be the total taxable value of land and additions on the property. | Land | Improvement |
|---|---|---|---|---|
| 2025 | $5,415 | $369,900 | $102,000 | $267,900 |
| 2024 | $5,272 | $362,600 | $102,000 | $260,600 |
| 2023 | $5,638 | $357,300 | $88,300 | $269,000 |
| 2022 | $5,394 | $334,800 | $88,300 | $246,500 |
| 2021 | $5,079 | $302,300 | $78,000 | $224,300 |
| 2020 | $4,948 | $294,000 | $76,800 | $217,200 |
| 2019 | $4,809 | $288,800 | $75,300 | $213,500 |
| 2018 | $4,540 | $273,300 | $75,300 | $198,000 |
| 2017 | $4,275 | $262,100 | $75,300 | $186,800 |
| 2016 | $4,131 | $255,300 | $75,300 | $180,000 |
| 2015 | $3,911 | $248,500 | $75,300 | $173,200 |
Source: Public Records
Map
Nearby Homes
- 47 Corey Colonial
- 178 Beekman Dr
- 2 Sabrina Way Unit D
- 121 Regency Park Dr
- 418 Meadow St Unit E1
- 34 Regency Park Dr
- 262 Regency Park Dr
- 204 Regency Park Dr
- 4H Mapleviewlane Unit 4H
- 0 Silver St
- 238 Elm St
- 42 Anthony St
- 1026 Main St
- 1077 Main St
- 57 Reed St
- 70 Reed St
- 13 Castle Hills Rd Unit B
- 762 Suffield St
- 15 B Castle Hills Rd Unit B
- 88 Country Rd
Your Personal Tour Guide
Ask me questions while you tour the home.