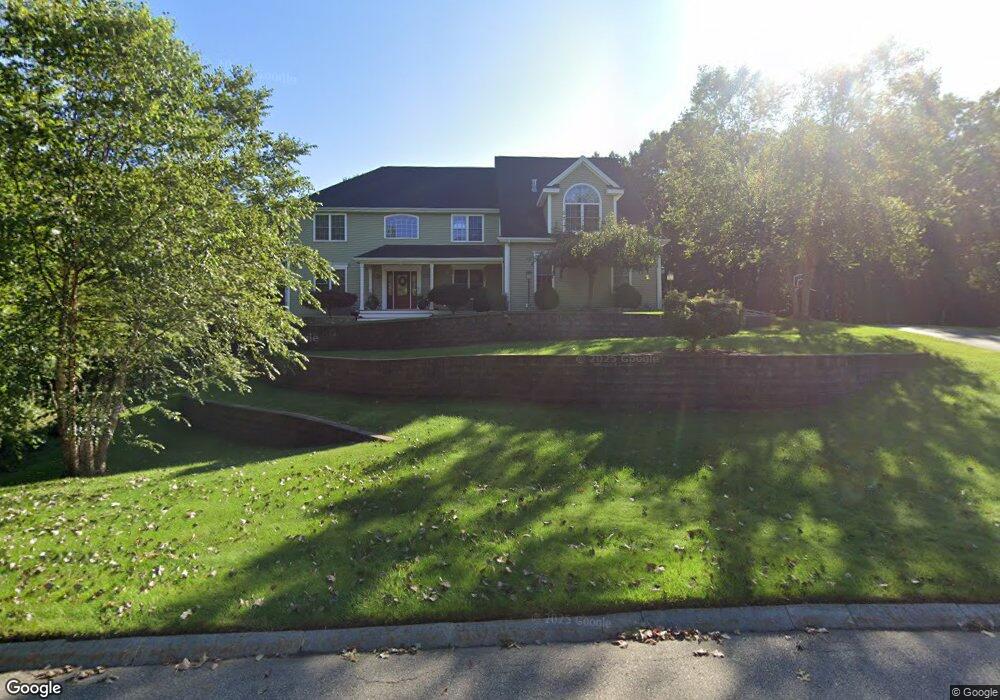
95 Henry b Riordan Way North Attleboro, MA 02760
North Attleboro NeighborhoodEstimated Value: $977,712 - $1,204,000
4
Beds
4
Baths
2,998
Sq Ft
$357/Sq Ft
Est. Value
About This Home
This home is located at 95 Henry b Riordan Way, North Attleboro, MA 02760 and is currently estimated at $1,071,678, approximately $357 per square foot. 95 Henry b Riordan Way is a home located in Bristol County with nearby schools including North Attleboro High School.
Ownership History
Date
Name
Owned For
Owner Type
Purchase Details
Closed on
Oct 20, 2021
Sold by
Michael Robert Kot Ret and Kot
Bought by
Costa-Kot Linda A and Kot Michael R
Current Estimated Value
Home Financials for this Owner
Home Financials are based on the most recent Mortgage that was taken out on this home.
Original Mortgage
$262,484
Outstanding Balance
$199,881
Interest Rate
2.9%
Mortgage Type
New Conventional
Estimated Equity
$871,797
Purchase Details
Closed on
Mar 23, 2011
Sold by
Kot Michael R and Costa-Kot Linda A
Bought by
Michael Robert Kot Ret
Purchase Details
Closed on
Aug 29, 2007
Sold by
Flair Homes Inc
Bought by
Costa-Kot Linda A and Kot Michael R
Home Financials for this Owner
Home Financials are based on the most recent Mortgage that was taken out on this home.
Original Mortgage
$417,000
Interest Rate
6.71%
Mortgage Type
Purchase Money Mortgage
Purchase Details
Closed on
Feb 26, 2007
Sold by
Rc Land Invest Corp
Bought by
Flair Homes Inc
Create a Home Valuation Report for This Property
The Home Valuation Report is an in-depth analysis detailing your home's value as well as a comparison with similar homes in the area
Home Values in the Area
Average Home Value in this Area
Purchase History
| Date | Buyer | Sale Price | Title Company |
|---|---|---|---|
| Costa-Kot Linda A | -- | None Available | |
| Michael Robert Kot Ret | -- | None Available | |
| Costa-Kot Linda A | -- | None Available | |
| Michael Robert Kot Ret | -- | -- | |
| Costa-Kot Linda A | $689,105 | -- | |
| Flair Homes Inc | -- | -- | |
| Michael Robert Kot Ret | -- | -- | |
| Costa-Kot Linda A | $689,105 | -- | |
| Flair Homes Inc | -- | -- |
Source: Public Records
Mortgage History
| Date | Status | Borrower | Loan Amount |
|---|---|---|---|
| Open | Costa-Kot Linda A | $262,484 | |
| Closed | Michael Robert Kot Ret | $262,484 | |
| Closed | Costa-Kot Linda A | $0 | |
| Previous Owner | Flair Homes Inc | $407,000 | |
| Previous Owner | Costa-Kot Linda A | $417,000 |
Source: Public Records
Tax History Compared to Growth
Tax History
| Year | Tax Paid | Tax Assessment Tax Assessment Total Assessment is a certain percentage of the fair market value that is determined by local assessors to be the total taxable value of land and additions on the property. | Land | Improvement |
|---|---|---|---|---|
| 2025 | $10,762 | $912,800 | $179,000 | $733,800 |
| 2024 | $11,502 | $996,700 | $186,300 | $810,400 |
| 2023 | $10,052 | $785,900 | $186,300 | $599,600 |
| 2022 | $9,970 | $715,700 | $193,500 | $522,200 |
| 2021 | $10,383 | $727,600 | $193,500 | $534,100 |
| 2020 | $9,569 | $666,800 | $193,500 | $473,300 |
| 2019 | $9,660 | $678,400 | $176,500 | $501,900 |
| 2018 | $8,635 | $647,300 | $183,200 | $464,100 |
| 2017 | $7,931 | $599,900 | $183,200 | $416,700 |
| 2016 | $8,212 | $621,200 | $210,500 | $410,700 |
| 2015 | $8,036 | $611,600 | $210,500 | $401,100 |
| 2014 | $7,413 | $559,900 | $175,900 | $384,000 |
Source: Public Records
Map
Nearby Homes
- 181 Paine Rd
- 740 Allen Ave
- 31 Paine Rd
- 44 Powder Horn Way
- 15 Harold w Bishop Blvd
- 34 Stone Ridge Rd
- 105 Newell Dr
- 41 Stone Ridge Rd
- 25 Gregory Way
- 9 Mount Hope St
- 49 Hoppin Hill Ave
- 1 Frederick a Nittel Dr
- 154 Bear Hill Rd Unit 1402
- 154 Bear Hill Rd Unit 306
- 0 Anawan Rd
- 30 Sperry Ln Unit Lot 15
- 11 Primrose Terrace
- 82 Reservoir St
- 15 Standring St
- 56 Farmview Dr
- 109 Henry b Riordan Way
- 87 Henry b Riordan Way
- 100 Henry b Riordan Way
- 86 Harry B Riordan Junior Way
- 86 Henry b Riordan Way
- 75 Henry b Riordan Way
- 116 Henry b Riordan Way
- 56 Autumn Dr
- 74 Henry b Riordan Way
- 117 Henry b Riordan Way
- 66 Autumn Dr
- 76 Autumn Dr
- 27 Thomas b Doolin Cir
- 11 Thomas b Doolin Cir
- 15 Thomas b Doolin Cir
- 41 Thomas b Doolin Cir
- 86 Autumn Dr
- 46 Autumn Dr
- 62 Harry B Riordan Junior Way
- 15 Leo j Ringuette Cir