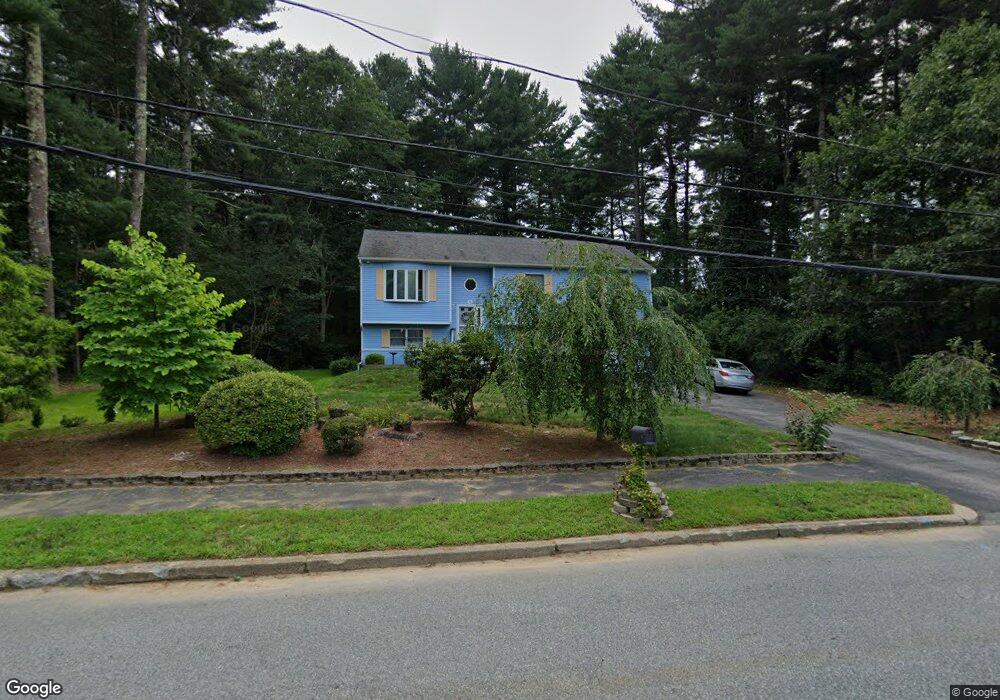
95 Jefferson Dr Coventry, RI 02816
Estimated Value: $526,000 - $565,129
3
Beds
2
Baths
2,530
Sq Ft
$216/Sq Ft
Est. Value
About This Home
This home is located at 95 Jefferson Dr, Coventry, RI 02816 and is currently estimated at $547,032, approximately $216 per square foot. 95 Jefferson Dr is a home located in Kent County with nearby schools including Alan Shawn Feinstein Ms Of Cov, Coventry High School, and Father John V. Doyle School.
Ownership History
Date
Name
Owned For
Owner Type
Purchase Details
Closed on
May 12, 2010
Sold by
Bergantine Christopher and Lecuyer Barbara
Bought by
Voccio Shirley
Current Estimated Value
Purchase Details
Closed on
Jul 30, 2008
Sold by
Dehinde Yutunde
Bought by
Lecuyer Barbara and Lecuyer Christopher
Home Financials for this Owner
Home Financials are based on the most recent Mortgage that was taken out on this home.
Original Mortgage
$241,214
Interest Rate
6.47%
Mortgage Type
Purchase Money Mortgage
Purchase Details
Closed on
Dec 3, 2003
Sold by
Cummings Charles and Cummings Frances
Bought by
Dehinde Yutunde
Purchase Details
Closed on
Feb 12, 2001
Sold by
Cummings Charles W
Bought by
C & R Prop & Holding
Create a Home Valuation Report for This Property
The Home Valuation Report is an in-depth analysis detailing your home's value as well as a comparison with similar homes in the area
Purchase History
| Date | Buyer | Sale Price | Title Company |
|---|---|---|---|
| Voccio Shirley | $225,000 | -- | |
| Lecuyer Barbara | $245,000 | -- | |
| Dehinde Yutunde | $295,000 | -- | |
| C & R Prop & Holding | $70,000 | -- |
Source: Public Records
Mortgage History
| Date | Status | Borrower | Loan Amount |
|---|---|---|---|
| Previous Owner | C & R Prop & Holding | $241,214 | |
| Previous Owner | C & R Prop & Holding | $324,000 | |
| Previous Owner | C & R Prop & Holding | $300,000 |
Source: Public Records
Tax History
| Year | Tax Paid | Tax Assessment Tax Assessment Total Assessment is a certain percentage of the fair market value that is determined by local assessors to be the total taxable value of land and additions on the property. | Land | Improvement |
|---|---|---|---|---|
| 2025 | $6,431 | $399,700 | $146,900 | $252,800 |
| 2024 | $6,429 | $405,900 | $146,900 | $259,000 |
| 2023 | $6,222 | $405,900 | $146,900 | $259,000 |
| 2022 | $6,239 | $318,800 | $139,000 | $179,800 |
| 2021 | $6,185 | $318,800 | $139,000 | $179,800 |
| 2020 | $7,090 | $318,800 | $139,000 | $179,800 |
| 2019 | $6,080 | $273,400 | $112,400 | $161,000 |
| 2018 | $5,910 | $273,500 | $112,400 | $161,100 |
| 2017 | $5,738 | $273,500 | $112,400 | $161,100 |
| 2016 | $5,415 | $252,900 | $123,100 | $129,800 |
| 2015 | $5,268 | $252,900 | $123,100 | $129,800 |
| 2014 | $4,954 | $252,900 | $123,100 | $129,800 |
| 2013 | $4,346 | $232,900 | $107,000 | $125,900 |
Source: Public Records
Map
Nearby Homes
Your Personal Tour Guide
Ask me questions while you tour the home.