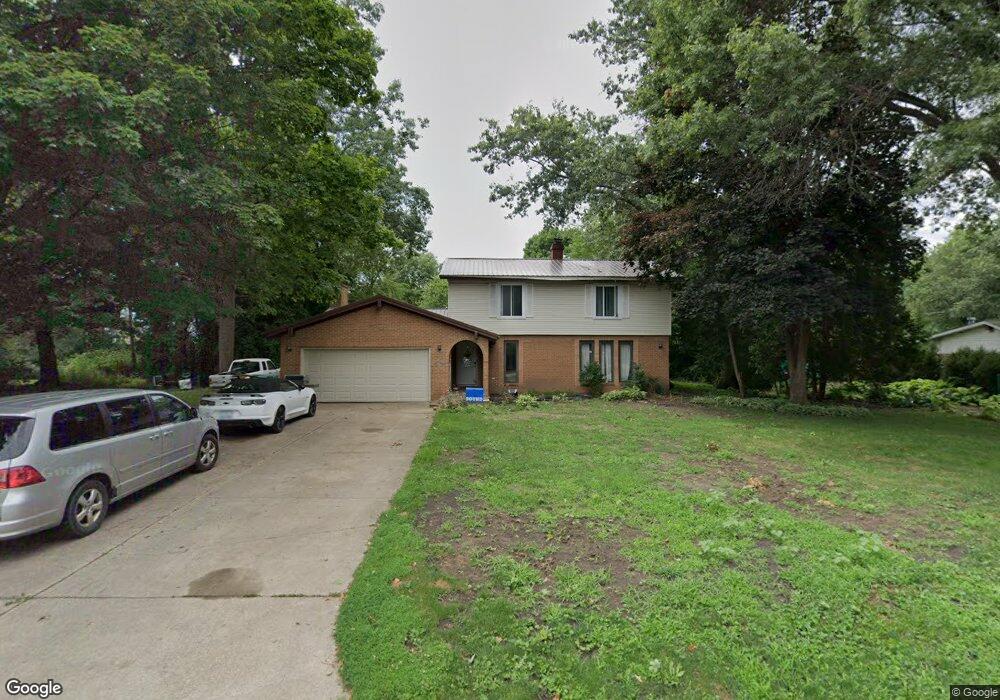
95 Keston Elm Dr La Porte, IN 46350
Estimated Value: $331,000 - $398,000
4
Beds
4
Baths
2,482
Sq Ft
$146/Sq Ft
Est. Value
About This Home
This home is located at 95 Keston Elm Dr, La Porte, IN 46350 and is currently estimated at $362,988, approximately $146 per square foot. 95 Keston Elm Dr is a home located in LaPorte County with nearby schools including La Porte High School, Kingsbury Elementary School, and Dunkerton High School.
Ownership History
Date
Name
Owned For
Owner Type
Purchase Details
Closed on
Oct 27, 2014
Sold by
Boren Dieken Sheila I and Boren Sheila I
Bought by
Boren Dieken Sheila I
Current Estimated Value
Home Financials for this Owner
Home Financials are based on the most recent Mortgage that was taken out on this home.
Original Mortgage
$188,692
Outstanding Balance
$146,491
Interest Rate
4.37%
Mortgage Type
FHA
Estimated Equity
$216,497
Purchase Details
Closed on
Oct 7, 2005
Sold by
Martin Bradley D and Martin Alison R
Bought by
Boren Sheila I
Home Financials for this Owner
Home Financials are based on the most recent Mortgage that was taken out on this home.
Original Mortgage
$150,400
Interest Rate
6.4%
Mortgage Type
Fannie Mae Freddie Mac
Create a Home Valuation Report for This Property
The Home Valuation Report is an in-depth analysis detailing your home's value as well as a comparison with similar homes in the area
Home Values in the Area
Average Home Value in this Area
Purchase History
| Date | Buyer | Sale Price | Title Company |
|---|---|---|---|
| Boren Dieken Sheila I | -- | None Available | |
| Boren Sheila I | -- | Meridian Title Corp |
Source: Public Records
Mortgage History
| Date | Status | Borrower | Loan Amount |
|---|---|---|---|
| Open | Boren Dieken Sheila I | $188,692 | |
| Closed | Boren Sheila I | $150,400 |
Source: Public Records
Tax History Compared to Growth
Tax History
| Year | Tax Paid | Tax Assessment Tax Assessment Total Assessment is a certain percentage of the fair market value that is determined by local assessors to be the total taxable value of land and additions on the property. | Land | Improvement |
|---|---|---|---|---|
| 2024 | $2,479 | $290,300 | $38,700 | $251,600 |
| 2023 | $2,400 | $240,000 | $34,800 | $205,200 |
| 2022 | $2,211 | $215,600 | $32,400 | $183,200 |
| 2021 | $2,066 | $200,900 | $32,400 | $168,500 |
| 2020 | $1,988 | $200,900 | $32,400 | $168,500 |
| 2019 | $1,995 | $189,300 | $32,400 | $156,900 |
| 2018 | $2,029 | $186,100 | $32,400 | $153,700 |
| 2017 | $1,875 | $170,700 | $32,400 | $138,300 |
| 2016 | $1,864 | $169,600 | $32,400 | $137,200 |
| 2014 | $1,870 | $176,200 | $32,300 | $143,900 |
Source: Public Records
Map
Nearby Homes
- 93 Keston Elm Dr
- 97 Keston Elm Dr
- 92 Keston Elm Dr
- 98 Keston Elm Dr
- 91 Keston Elm Dr
- 99 Keston Elm Dr
- 604 E 18th St
- 606 E 18th St
- 90 Keston Elm Dr
- 89 Keston Elm Dr
- 101 Keston Elm Dr
- 32 Keston Elm Dr
- 66 Keston Elm Dr
- 88 Keston Elm Dr
- 85 Keston Elm Dr
- 85 Keston Elm Dr
- 103 Keston Elm Dr
- 68 Keston Elm Dr
- 80 Keston Elm Dr
- 35 Keston Elm Dr