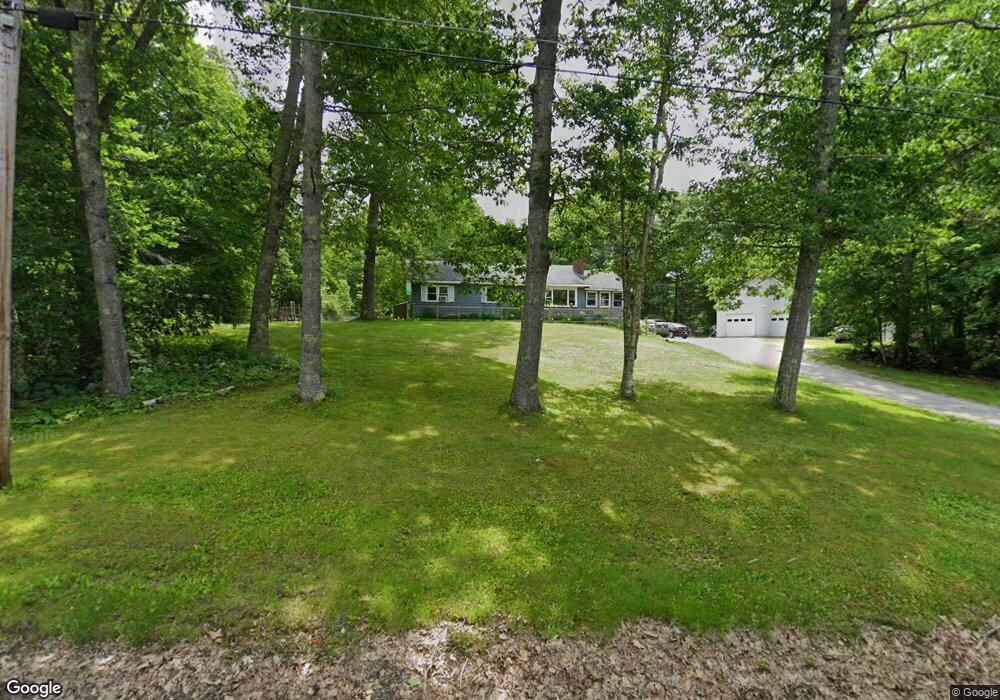
95 Linscott Rd Jefferson, ME 04348
Estimated Value: $346,431 - $441,000
3
Beds
1
Bath
1,672
Sq Ft
$227/Sq Ft
Est. Value
About This Home
This home is located at 95 Linscott Rd, Jefferson, ME 04348 and is currently estimated at $379,144, approximately $226 per square foot. 95 Linscott Rd is a home located in Lincoln County with nearby schools including Jefferson Village School.
Ownership History
Date
Name
Owned For
Owner Type
Purchase Details
Closed on
Dec 23, 2022
Sold by
Winchenbach Josiah A and Winchenbach Molly S
Bought by
Winchenbach Molly S
Current Estimated Value
Home Financials for this Owner
Home Financials are based on the most recent Mortgage that was taken out on this home.
Original Mortgage
$225,000
Outstanding Balance
$216,854
Interest Rate
6.61%
Mortgage Type
Purchase Money Mortgage
Estimated Equity
$162,290
Purchase Details
Closed on
Sep 23, 2008
Sold by
Holmes Terrance L and Holmes Joan A
Bought by
Winchenbach Josiah A and Winchenbach Molly S
Home Financials for this Owner
Home Financials are based on the most recent Mortgage that was taken out on this home.
Original Mortgage
$168,772
Interest Rate
6.54%
Mortgage Type
FHA
Purchase Details
Closed on
Apr 19, 2005
Sold by
Donahue Daniel J and Donahue Karen L
Bought by
Holmes Terrance L and Holmes Jo A
Home Financials for this Owner
Home Financials are based on the most recent Mortgage that was taken out on this home.
Original Mortgage
$115,700
Interest Rate
5.78%
Mortgage Type
Commercial
Create a Home Valuation Report for This Property
The Home Valuation Report is an in-depth analysis detailing your home's value as well as a comparison with similar homes in the area
Home Values in the Area
Average Home Value in this Area
Purchase History
| Date | Buyer | Sale Price | Title Company |
|---|---|---|---|
| Winchenbach Molly S | -- | None Available | |
| Winchenbach Josiah A | -- | -- | |
| Winchenbach Josiah A | -- | -- | |
| Holmes Terrance L | -- | -- | |
| Holmes Terrance L | -- | -- |
Source: Public Records
Mortgage History
| Date | Status | Borrower | Loan Amount |
|---|---|---|---|
| Open | Winchenbach Molly S | $225,000 | |
| Previous Owner | Winchenbach Josiah A | $168,772 | |
| Previous Owner | Holmes Terrance L | $115,700 |
Source: Public Records
Tax History
| Year | Tax Paid | Tax Assessment Tax Assessment Total Assessment is a certain percentage of the fair market value that is determined by local assessors to be the total taxable value of land and additions on the property. | Land | Improvement |
|---|---|---|---|---|
| 2024 | $3,311 | $273,400 | $60,600 | $212,800 |
| 2023 | $3,093 | $188,600 | $41,800 | $146,800 |
| 2022 | $2,838 | $188,600 | $41,800 | $146,800 |
| 2021 | $2,716 | $188,600 | $41,800 | $146,800 |
| 2020 | $1,619 | $188,600 | $41,800 | $146,800 |
| 2019 | $1,542 | $188,600 | $41,800 | $146,800 |
| 2018 | $1,496 | $187,500 | $41,800 | $145,700 |
| 2017 | $2,046 | $160,500 | $41,800 | $118,700 |
| 2016 | $2,054 | $161,100 | $41,800 | $119,300 |
| 2015 | $2,000 | $160,000 | $41,800 | $118,200 |
| 2014 | $1,927 | $160,600 | $41,800 | $118,800 |
Source: Public Records
Map
Nearby Homes
- 304 Goose Hill Rd
- 286 Washington Rd
- 9 E Pond Rd
- 217 Waldoboro Rd
- 481 Washington Rd
- 3 Tackle Trail
- 20 Lake Farm Cir
- 330 E Pond Rd
- 187 Fitch Rd
- 0 Sky High Dr
- 33(Lot19C) Christmas Tree Ln
- 17 Heron Cove Rd
- Lot#009-02 Powderhorn Rd
- 1515 Old Augusta Rd
- 317 Augusta Rd
- 2545 Washington Rd
- 305 Augusta Rd
- 784 E Pond Rd
- 1443 Old Augusta Rd
- M19-L16-1 Augusta Rd
- 101 Linscott Rd
- 100 Linscott Rd
- 89 Linscott Rd
- 91 Linscott Rd
- 114 Linscott Rd
- 20 Four K Ln
- 79 Linscott Rd
- 90 Linscott Rd
- 102 Linscott Rd
- 115 Linscott Rd
- 78 Linscott Rd
- 133 Linscott Rd
- 61 Linscott Rd
- 126 Linscott Rd
- 60 Linscott Rd
- 53 Linscott Rd
- 52 Linscott Rd
- 152 Linscott Rd
- 45 Linscott Rd
- 36 Pebble Rd
Your Personal Tour Guide
Ask me questions while you tour the home.