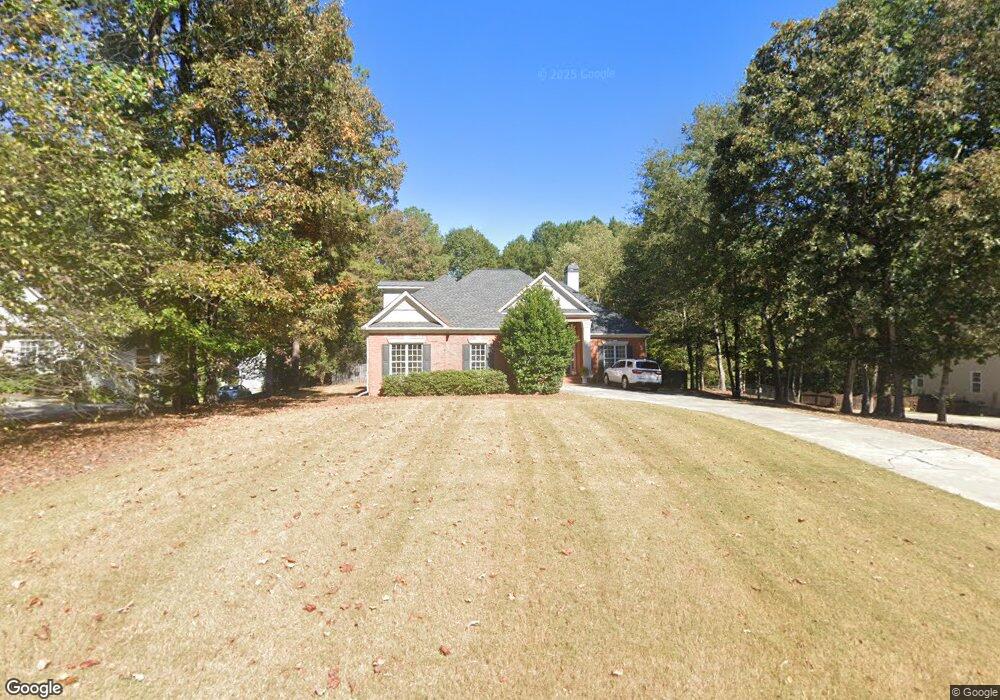
95 Lyndhurst Way Sharpsburg, GA 30277
Estimated Value: $475,298 - $509,000
4
Beds
4
Baths
2,381
Sq Ft
$206/Sq Ft
Est. Value
About This Home
This home is located at 95 Lyndhurst Way, Sharpsburg, GA 30277 and is currently estimated at $490,075, approximately $205 per square foot. 95 Lyndhurst Way is a home located in Coweta County with nearby schools including Canongate Elementary School, Lee Middle School, and Northgate High School.
Ownership History
Date
Name
Owned For
Owner Type
Purchase Details
Closed on
Mar 23, 2021
Sold by
Thomas Robin C
Bought by
Rosso Cynthia Deanne
Current Estimated Value
Purchase Details
Closed on
Sep 23, 2013
Sold by
Thomas James R
Bought by
Rct Trust
Purchase Details
Closed on
Jun 8, 2007
Sold by
Moore Jeanne M
Bought by
Thomas James R and Thomas Robin C
Home Financials for this Owner
Home Financials are based on the most recent Mortgage that was taken out on this home.
Original Mortgage
$120,000
Interest Rate
6.12%
Mortgage Type
New Conventional
Purchase Details
Closed on
Oct 9, 2001
Sold by
Weststar Builders & Dev Inc
Bought by
Moore Jeanne M
Home Financials for this Owner
Home Financials are based on the most recent Mortgage that was taken out on this home.
Original Mortgage
$203,608
Interest Rate
6.87%
Mortgage Type
New Conventional
Purchase Details
Closed on
Feb 22, 2001
Sold by
Reese Builders & Developers In
Bought by
Weststar Builders & Developers Inc
Purchase Details
Closed on
May 2, 1995
Sold by
Bell Larmar A and Bell Esth
Bought by
Reese Builders & Developers Inc
Create a Home Valuation Report for This Property
The Home Valuation Report is an in-depth analysis detailing your home's value as well as a comparison with similar homes in the area
Home Values in the Area
Average Home Value in this Area
Purchase History
| Date | Buyer | Sale Price | Title Company |
|---|---|---|---|
| Rosso Cynthia Deanne | $353,000 | -- | |
| Rct Trust | -- | -- | |
| Thomas James R | $362,000 | -- | |
| Moore Jeanne M | $214,400 | -- | |
| Weststar Builders & Developers Inc | $169,500 | -- | |
| Reese Builders & Developers Inc | $1,120,800 | -- |
Source: Public Records
Mortgage History
| Date | Status | Borrower | Loan Amount |
|---|---|---|---|
| Previous Owner | Thomas James R | $120,000 | |
| Previous Owner | Moore Jeanne M | $203,608 |
Source: Public Records
Tax History Compared to Growth
Tax History
| Year | Tax Paid | Tax Assessment Tax Assessment Total Assessment is a certain percentage of the fair market value that is determined by local assessors to be the total taxable value of land and additions on the property. | Land | Improvement |
|---|---|---|---|---|
| 2025 | $4,312 | $182,491 | $32,000 | $150,491 |
| 2024 | $4,172 | $179,731 | $32,000 | $147,731 |
| 2023 | $4,172 | $146,808 | $26,000 | $120,808 |
| 2022 | $3,295 | $133,756 | $26,000 | $107,756 |
| 2021 | $1,967 | $117,172 | $20,000 | $97,172 |
| 2020 | $1,977 | $117,172 | $20,000 | $97,172 |
| 2019 | $2,788 | $100,067 | $22,000 | $78,067 |
| 2018 | $2,794 | $100,067 | $22,000 | $78,067 |
| 2017 | $2,493 | $100,067 | $22,000 | $78,067 |
| 2016 | $2,422 | $83,648 | $22,000 | $61,648 |
| 2015 | $2,381 | $83,648 | $22,000 | $61,648 |
| 2014 | $1,767 | $79,248 | $17,600 | $61,648 |
Source: Public Records
Map
Nearby Homes
- 75 Tomahawk Dr
- 95 Tyler Woods Dr
- 12 Race Point Way
- 115 Platinum Ridge
- 121 Northwoods Rd
- 125 Cannongate Cir
- 10 Fisher Way
- 10 Queens Ct
- 2039 Fischer Rd
- 2043 Fischer Rd
- 131 Cannongate Cir
- 68 Timbercreek Estates Dr
- 0 Maple Trail
- 208 Silver Maple Ct
- 107 Iron Oak Dr
- 259 Strathmore Dr Unit 3
- 75 Kripple Kreek Dr
- 223 Sweetbay Ct
- 319 Le Paradis Blvd
- 136 Barrington Grange Dr
- 105 Lyndhurst Way
- 85 Lyndhurst Way
- 0 Lyndhurst Way Unit 8550482
- 0 Lyndhurst Way Unit 8573082
- 0 Lyndhurst Way Unit 8808382
- 0 Lyndhurst Way Unit 8834559
- 0 Lyndhurst Way Unit 8869872
- 0 Lyndhurst Way Unit 3219386
- 75 Lyndhurst Way
- 75 Lyndhurst Way Unit C
- 115 Lyndhurst Way
- 90 Lyndhurst Way
- 100 Lyndhurst Way
- 80 Lyndhurst Way
- 125 Lyndhurst Way
- 65 Lyndhurst Way
- 110 Lyndhurst Way Unit 119
- 110 Lyndhurst Way
- 120 Lyndhurst Way
- 120 Lyndhurst Way Unit C