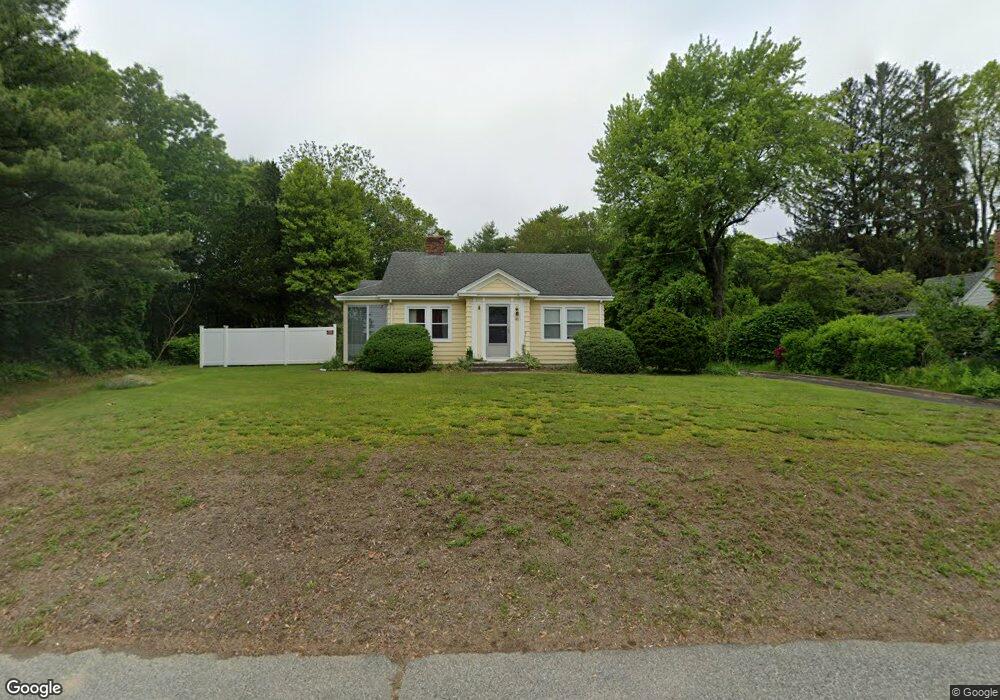
95 Main St Ashaway, RI 02804
Ashley-Bradford NeighborhoodEstimated Value: $311,000 - $466,000
3
Beds
1
Bath
1,364
Sq Ft
$282/Sq Ft
Est. Value
About This Home
This home is located at 95 Main St, Ashaway, RI 02804 and is currently estimated at $384,954, approximately $282 per square foot. 95 Main St is a home located in Washington County with nearby schools including Chariho Regional Middle School, Chariho High School, and St. Michael School.
Ownership History
Date
Name
Owned For
Owner Type
Purchase Details
Closed on
Dec 4, 2018
Sold by
Mcdonald Susan L
Bought by
Mcdonald Susan L and Lillibridge William J
Current Estimated Value
Purchase Details
Closed on
Aug 21, 2000
Sold by
Panciera Rebella
Bought by
Mcdonald Kevin N and Cosentino Susan
Home Financials for this Owner
Home Financials are based on the most recent Mortgage that was taken out on this home.
Original Mortgage
$90,000
Interest Rate
8.13%
Create a Home Valuation Report for This Property
The Home Valuation Report is an in-depth analysis detailing your home's value as well as a comparison with similar homes in the area
Home Values in the Area
Average Home Value in this Area
Purchase History
| Date | Buyer | Sale Price | Title Company |
|---|---|---|---|
| Mcdonald Susan L | -- | -- | |
| Mcdonald Kevin N | $95,000 | -- |
Source: Public Records
Mortgage History
| Date | Status | Borrower | Loan Amount |
|---|---|---|---|
| Previous Owner | Mcdonald Kevin N | $90,000 |
Source: Public Records
Tax History
| Year | Tax Paid | Tax Assessment Tax Assessment Total Assessment is a certain percentage of the fair market value that is determined by local assessors to be the total taxable value of land and additions on the property. | Land | Improvement |
|---|---|---|---|---|
| 2025 | $3,413 | $223,200 | $83,500 | $139,700 |
| 2024 | $3,361 | $223,200 | $83,500 | $139,700 |
| 2023 | $3,272 | $223,200 | $83,500 | $139,700 |
| 2022 | $2,833 | $152,900 | $44,500 | $108,400 |
| 2021 | $2,833 | $152,900 | $44,500 | $108,400 |
| 2020 | $2,795 | $152,900 | $44,500 | $108,400 |
| 2019 | $3,493 | $168,900 | $62,400 | $106,500 |
| 2018 | $3,390 | $168,900 | $62,400 | $106,500 |
| 2017 | $3,390 | $168,900 | $62,400 | $106,500 |
| 2016 | $3,325 | $161,100 | $55,600 | $105,500 |
| 2015 | $3,283 | $161,100 | $55,600 | $105,500 |
| 2014 | $3,325 | $161,100 | $55,600 | $105,500 |
| 2013 | $3,161 | $159,900 | $51,400 | $108,500 |
Source: Public Records
Map
Nearby Homes
Your Personal Tour Guide
Ask me questions while you tour the home.