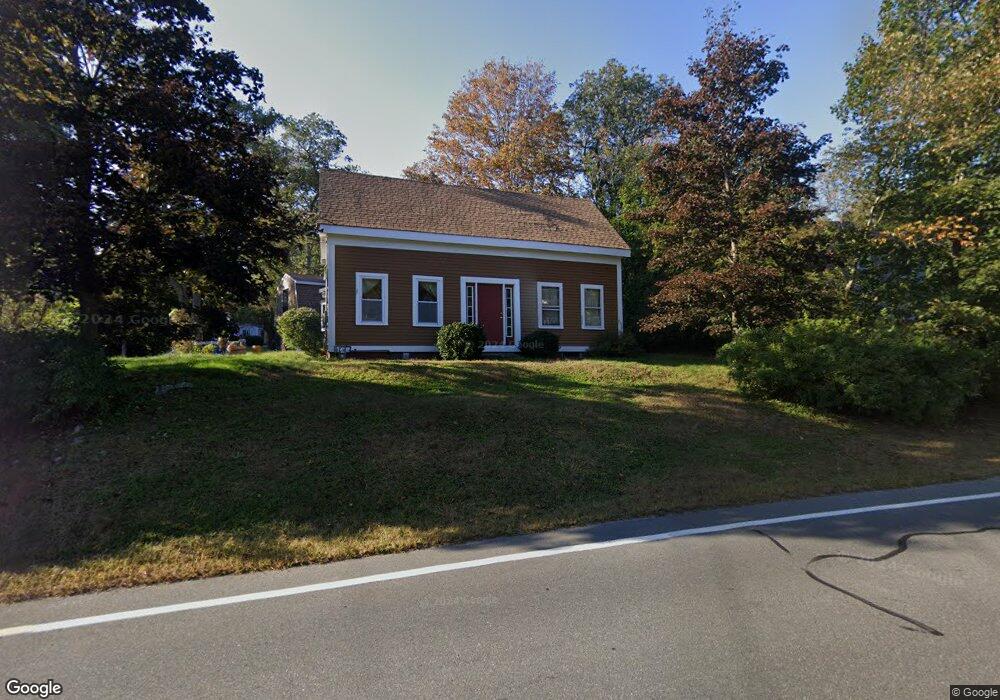
95 Main St Byfield, MA 01922
Estimated Value: $607,000 - $713,000
3
Beds
2
Baths
1,655
Sq Ft
$407/Sq Ft
Est. Value
About This Home
This home is located at 95 Main St, Byfield, MA 01922 and is currently estimated at $673,300, approximately $406 per square foot. 95 Main St is a home located in Essex County with nearby schools including Triton Regional High School and The Governors Academy.
Ownership History
Date
Name
Owned For
Owner Type
Purchase Details
Closed on
Oct 30, 2018
Sold by
Bear Charles and Wik Elizabeth B
Bought by
Charles Bear Irt Of 2018 and Bear
Current Estimated Value
Home Financials for this Owner
Home Financials are based on the most recent Mortgage that was taken out on this home.
Original Mortgage
$200,000
Interest Rate
4.7%
Mortgage Type
New Conventional
Purchase Details
Closed on
Jan 4, 2005
Sold by
Bear Ft and Tremblay
Bought by
Tremblay Ruth E
Home Financials for this Owner
Home Financials are based on the most recent Mortgage that was taken out on this home.
Original Mortgage
$54,000
Interest Rate
5.73%
Mortgage Type
Purchase Money Mortgage
Create a Home Valuation Report for This Property
The Home Valuation Report is an in-depth analysis detailing your home's value as well as a comparison with similar homes in the area
Home Values in the Area
Average Home Value in this Area
Purchase History
| Date | Buyer | Sale Price | Title Company |
|---|---|---|---|
| Charles Bear Irt Of 2018 | -- | -- | |
| Charles Bear Irt Of 2018 | -- | -- | |
| Bear Charles | -- | -- | |
| Bear Charles | -- | -- | |
| Charles Bear Irt Of 2018 | -- | -- | |
| Bear Charles | -- | -- | |
| Tremblay Ruth E | -- | -- | |
| Tremblay Ruth E | -- | -- |
Source: Public Records
Mortgage History
| Date | Status | Borrower | Loan Amount |
|---|---|---|---|
| Previous Owner | Bear Charles | $200,000 | |
| Previous Owner | Tremblay Ruth E | $54,000 | |
| Previous Owner | Tremblay Ruth E | $15,003 |
Source: Public Records
Tax History
| Year | Tax Paid | Tax Assessment Tax Assessment Total Assessment is a certain percentage of the fair market value that is determined by local assessors to be the total taxable value of land and additions on the property. | Land | Improvement |
|---|---|---|---|---|
| 2025 | $5,211 | $699,500 | $377,800 | $321,700 |
| 2024 | $4,927 | $641,600 | $338,000 | $303,600 |
| 2023 | $4,915 | $566,900 | $288,300 | $278,600 |
| 2022 | $4,902 | $503,800 | $258,500 | $245,300 |
| 2021 | $4,592 | $430,800 | $198,800 | $232,000 |
| 2020 | $4,661 | $424,100 | $198,800 | $225,300 |
| 2019 | $4,370 | $404,300 | $179,000 | $225,300 |
| 2018 | $4,225 | $387,600 | $179,000 | $208,600 |
| 2017 | $4,059 | $382,600 | $179,000 | $203,600 |
| 2016 | $3,545 | $311,000 | $139,200 | $171,800 |
| 2015 | $3,431 | $297,800 | $129,200 | $168,600 |
| 2014 | $3,371 | $297,800 | $129,200 | $168,600 |
Source: Public Records
Map
Nearby Homes
- 5 Oak Terrace
- 17 Church St
- 33 Downfall Rd
- 18 Forest St
- 38 Main St
- 34 Central St
- 55 Pearson Dr Unit 9 - ALDER
- 55 Pearson Dr Unit 8-Dogwood
- 55 Pearson Dr Unit 11-Chestnut
- 55 Pearson Dr Unit 3 - ALDER
- 55 Pearson Dr Unit 6-Dogwood
- 38 Pearson Dr
- 13 Main St
- 11 Main St
- 66 Parish Rd Unit 8
- 66 Parish Rd Unit 4
- 36 Caldwell Farm Rd
- 126 Georgetown Rd
- 167 Middle St
- 14 Sawmill Brook Rd
Your Personal Tour Guide
Ask me questions while you tour the home.