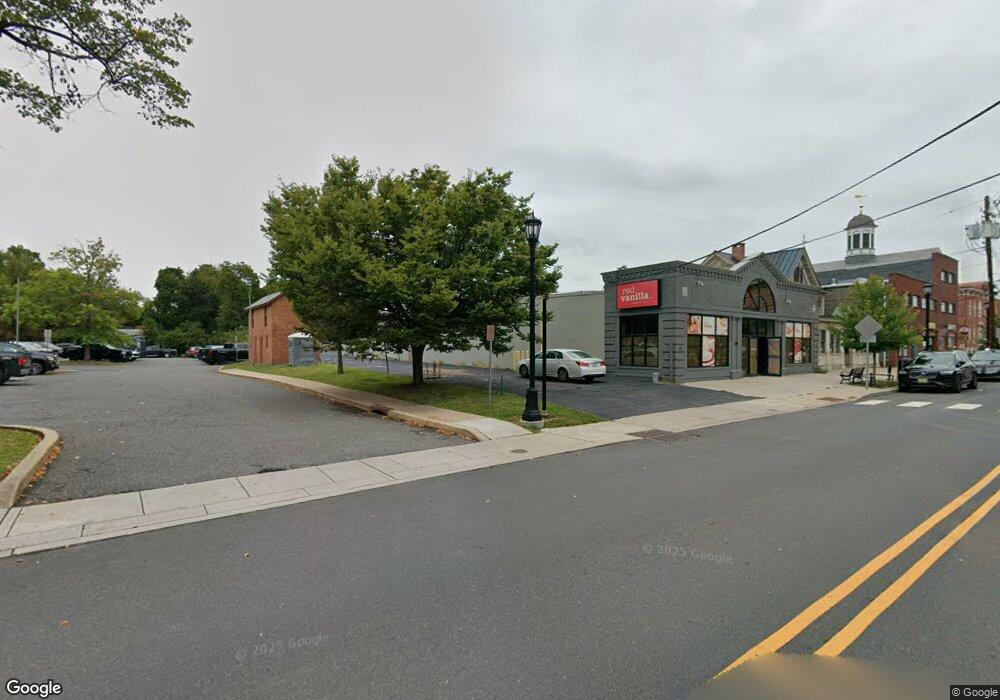
95 Main St Unit 95 Flemington, NJ 08822
Estimated Value: $1,664,563
Studio
--
Bath
8,100
Sq Ft
$206/Sq Ft
Est. Value
About This Home
This home is located at 95 Main St Unit 95, Flemington, NJ 08822 and is currently estimated at $1,664,563, approximately $205 per square foot. 95 Main St Unit 95 is a home located in Hunterdon County with nearby schools including Robert Hunter Elementary School, Reading Fleming Intermediate School, and J.P. Case Middle School.
Ownership History
Date
Name
Owned For
Owner Type
Purchase Details
Closed on
Nov 27, 2024
Sold by
Main Street Associates
Bought by
95 Main Street Enterprises Llc
Current Estimated Value
Home Financials for this Owner
Home Financials are based on the most recent Mortgage that was taken out on this home.
Original Mortgage
$1,125,000
Outstanding Balance
$979,511
Interest Rate
6.78%
Mortgage Type
New Conventional
Estimated Equity
$685,052
Create a Home Valuation Report for This Property
The Home Valuation Report is an in-depth analysis detailing your home's value as well as a comparison with similar homes in the area
Home Values in the Area
Average Home Value in this Area
Purchase History
| Date | Buyer | Sale Price | Title Company |
|---|---|---|---|
| 95 Main Street Enterprises Llc | $1,550,000 | Old Republic Title | |
| 95 Main Street Enterprises Llc | $1,550,000 | Old Republic Title |
Source: Public Records
Mortgage History
| Date | Status | Borrower | Loan Amount |
|---|---|---|---|
| Open | 95 Main Street Enterprises Llc | $1,125,000 | |
| Closed | 95 Main Street Enterprises Llc | $1,125,000 |
Source: Public Records
Tax History
| Year | Tax Paid | Tax Assessment Tax Assessment Total Assessment is a certain percentage of the fair market value that is determined by local assessors to be the total taxable value of land and additions on the property. | Land | Improvement |
|---|---|---|---|---|
| 2025 | $28,567 | $1,380,000 | $465,000 | $915,000 |
| 2024 | $26,548 | $970,000 | $435,000 | $535,000 |
Source: Public Records
Map
Nearby Homes
Your Personal Tour Guide
Ask me questions while you tour the home.