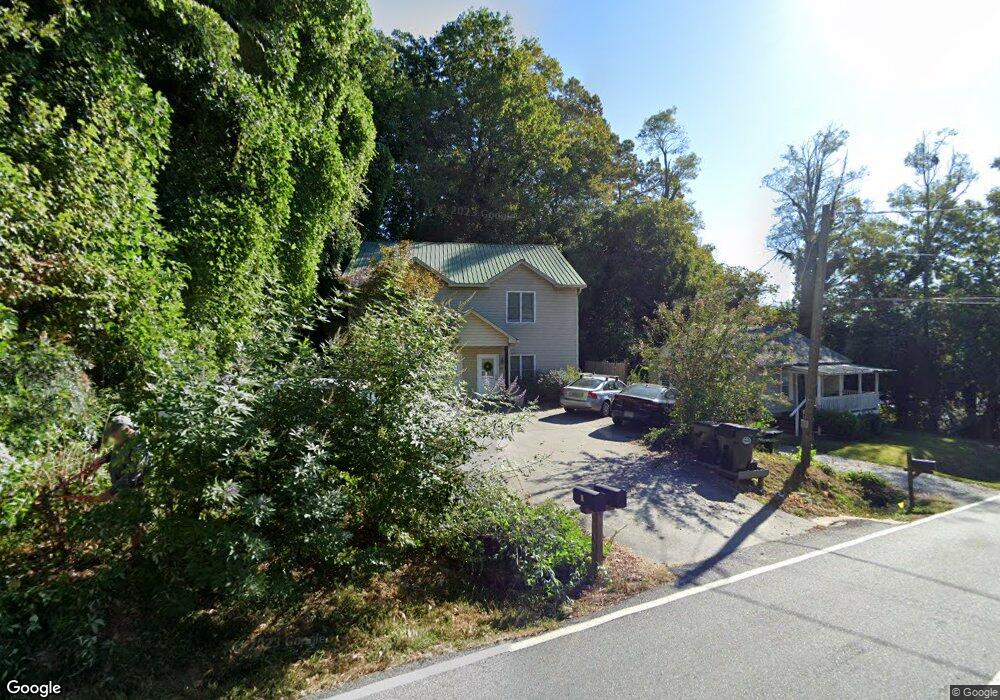
95 Mechanic St Dahlonega, GA 30533
Estimated Value: $312,972 - $454,000
--
Bed
1
Bath
528
Sq Ft
$755/Sq Ft
Est. Value
About This Home
This home is located at 95 Mechanic St, Dahlonega, GA 30533 and is currently estimated at $398,743, approximately $755 per square foot. 95 Mechanic St is a home located in Lumpkin County with nearby schools including Clay County Middle School and Lumpkin County High School.
Ownership History
Date
Name
Owned For
Owner Type
Purchase Details
Closed on
Sep 2, 2021
Sold by
Taylor C Stephen
Bought by
Trahlyta Properties Llc
Current Estimated Value
Purchase Details
Closed on
Oct 19, 2010
Sold by
Taylor C Stephen
Bought by
Taylor C Stephen
Purchase Details
Closed on
Jul 27, 2006
Sold by
Not Provided
Bought by
Taylor C Stephen and Taylor Jane H
Purchase Details
Closed on
Nov 24, 2003
Sold by
Brooks William Jake
Bought by
Taylor Taylor C and Taylor Laura B
Purchase Details
Closed on
Jun 27, 1997
Sold by
Helyn E
Bought by
Brooks William Jake
Purchase Details
Closed on
Aug 16, 1994
Sold by
Brenda S
Bought by
Branson James E
Purchase Details
Closed on
Aug 16, 1993
Bought by
Hennessey Priscilla
Purchase Details
Closed on
Jun 1, 1993
Bought by
Lumpkin County Bank
Purchase Details
Closed on
Jul 31, 1989
Sold by
Lois A
Bought by
Touroyan John P
Purchase Details
Closed on
Mar 1, 1985
Bought by
Woody William W
Create a Home Valuation Report for This Property
The Home Valuation Report is an in-depth analysis detailing your home's value as well as a comparison with similar homes in the area
Home Values in the Area
Average Home Value in this Area
Purchase History
| Date | Buyer | Sale Price | Title Company |
|---|---|---|---|
| Trahlyta Properties Llc | -- | -- | |
| Taylor C Stephen | -- | -- | |
| Taylor C Stephen | -- | -- | |
| Taylor Taylor C | $110,000 | -- | |
| Brooks William Jake | $27,000 | -- | |
| Branson James E | $24,000 | -- | |
| Hennessey Priscilla | $21,500 | -- | |
| Lumpkin County Bank | -- | -- | |
| Touroyan John P | $22,500 | -- | |
| Woody William W | -- | -- |
Source: Public Records
Mortgage History
| Date | Status | Borrower | Loan Amount |
|---|---|---|---|
| Closed | Taylor C Stephen | $0 |
Source: Public Records
Tax History Compared to Growth
Tax History
| Year | Tax Paid | Tax Assessment Tax Assessment Total Assessment is a certain percentage of the fair market value that is determined by local assessors to be the total taxable value of land and additions on the property. | Land | Improvement |
|---|---|---|---|---|
| 2024 | $3,175 | $116,339 | $26,403 | $89,936 |
| 2023 | $3,143 | $109,044 | $26,403 | $82,641 |
| 2022 | $3,190 | $104,419 | $26,403 | $78,016 |
| 2021 | $2,814 | $86,267 | $26,403 | $59,864 |
| 2020 | $2,916 | $86,028 | $26,403 | $59,625 |
| 2019 | $2,930 | $86,028 | $26,403 | $59,625 |
| 2018 | $3,098 | $85,127 | $26,403 | $58,724 |
| 2017 | $3,158 | $85,315 | $26,403 | $58,912 |
| 2016 | $3,203 | $84,661 | $26,403 | $58,258 |
| 2015 | $2,768 | $84,660 | $26,403 | $58,258 |
| 2014 | $2,768 | $85,520 | $26,403 | $59,118 |
| 2013 | -- | $86,374 | $26,402 | $59,971 |
Source: Public Records
Map
Nearby Homes
- 6480A Highway 52
- 329 Morrison Moore Pkwy E
- 120 Riley Rd
- 0 Highway 19 N Unit 10594984
- 1392 S Chestatee St
- 0 Highway 60 Unit 7241582
- 0 S Chestatee St Unit 10619536
- 22 Honeysuckle Ln
- 0 Highway 9 S Unit 10487179
- 0 Highway 9 S Unit 7548614
- 95 Jones St
- 315 Church St
- 168 W Main St
- 399 N Chestatee St
- 502 Wimpy Mill Rd
- 0 Calhoun Rd Unit 7643314
- 0 Calhoun Rd Unit 10598012
- 00 Calhoun Rd
- 0 Alicia Ln
- 19 Stoneybrook Dr
- 95 Mechanic St SE Unit B
- 105 Mechanic St SE
- 305 S Grove St Unit none
- 305 S Grove St
- 305 S Grove St
- 86 Mechanic St
- 315 S Grove St Unit c
- 315 S Grove St
- 315 S Grove St Unit 1
- 110 Mechanic St Unit E
- 110 Mechanic St
- 110 Mechanic St SE
- 282 Martin St
- 1.25+/- AC Memorial Dr
- 293 S Grove St
- 292 S Grove St
- 165 Alma St
- 247 Arcadia St
- 0 Alma St
- 258 Martin St