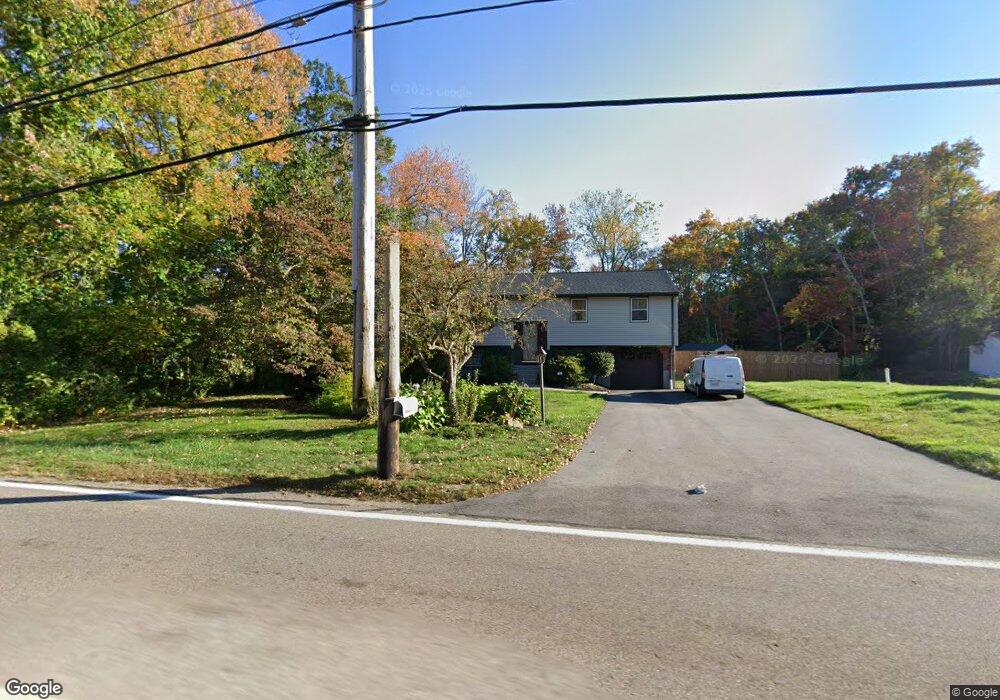
95 Milford St Medway, MA 02053
Estimated Value: $500,000 - $613,000
3
Beds
2
Baths
1,290
Sq Ft
$438/Sq Ft
Est. Value
About This Home
This home is located at 95 Milford St, Medway, MA 02053 and is currently estimated at $564,969, approximately $437 per square foot. 95 Milford St is a home located in Norfolk County with nearby schools including John D. McGovern Elementary School, Burke-Memorial Elementary, and Medway Middle School.
Ownership History
Date
Name
Owned For
Owner Type
Purchase Details
Closed on
Oct 20, 2011
Sold by
Est Mckenna D J and Young Peter J
Bought by
Pagano Joseph M and Pagano Therese M
Current Estimated Value
Home Financials for this Owner
Home Financials are based on the most recent Mortgage that was taken out on this home.
Original Mortgage
$243,662
Outstanding Balance
$166,347
Interest Rate
4.12%
Mortgage Type
FHA
Estimated Equity
$398,622
Create a Home Valuation Report for This Property
The Home Valuation Report is an in-depth analysis detailing your home's value as well as a comparison with similar homes in the area
Home Values in the Area
Average Home Value in this Area
Purchase History
| Date | Buyer | Sale Price | Title Company |
|---|---|---|---|
| Pagano Joseph M | $250,000 | -- |
Source: Public Records
Mortgage History
| Date | Status | Borrower | Loan Amount |
|---|---|---|---|
| Open | Pagano Joseph M | $243,662 |
Source: Public Records
Tax History Compared to Growth
Tax History
| Year | Tax Paid | Tax Assessment Tax Assessment Total Assessment is a certain percentage of the fair market value that is determined by local assessors to be the total taxable value of land and additions on the property. | Land | Improvement |
|---|---|---|---|---|
| 2025 | $6,975 | $489,500 | $257,000 | $232,500 |
| 2024 | $7,049 | $489,500 | $257,000 | $232,500 |
| 2023 | $7,017 | $440,200 | $224,900 | $215,300 |
| 2022 | $6,560 | $387,500 | $190,900 | $196,600 |
| 2021 | $6,273 | $359,300 | $172,800 | $186,500 |
| 2020 | $5,880 | $336,000 | $152,800 | $183,200 |
| 2019 | $5,452 | $321,300 | $144,800 | $176,500 |
| 2018 | $5,614 | $317,900 | $144,800 | $173,100 |
| 2017 | $5,217 | $291,100 | $134,700 | $156,400 |
| 2016 | $5,087 | $280,900 | $126,700 | $154,200 |
| 2015 | $5,023 | $275,400 | $119,700 | $155,700 |
| 2014 | $4,635 | $246,000 | $114,900 | $131,100 |
Source: Public Records
Map
Nearby Homes
- 6 Rainbow Dr
- 4 Deerfield Rd
- 22 Granite St
- 78 Fisher St
- 85 Fisher St
- 9 Tulip Way
- 39 West St
- 0 Old Log Lane (Farm St) Unit 73416329
- 462 Hartford Ave
- 6 Freedom Trail
- 455 Hartford Ave
- 5 Fales St
- 220 Main St Unit 220
- 190-194 E Main St
- 48 Black Bear Cir Unit 48
- 11 Black Bear Unit 11
- 43 Black Bear Cir Unit 43
- 9 Black Bear Cir Unit 9
- 7 Black Bear Unit 7
- 3 Black Bear Cir Unit 3
- 97 Milford St
- 99 Milford St
- 93 Milford St
- 100 Milford St
- 101 Milford St
- 103 Milford St
- 2 Rainbow Dr
- 1 Grey Squirrel Cir
- 94 Milford St
- 105 Milford St
- 8 Rainbow Dr
- 110 West St
- 112 West St
- 114 West St
- 108 West St
- 116 West St
- 106 West St
- 108 Milford St Unit 2
- 108 Milford St Unit 1
- 108 Milford St Unit 1st