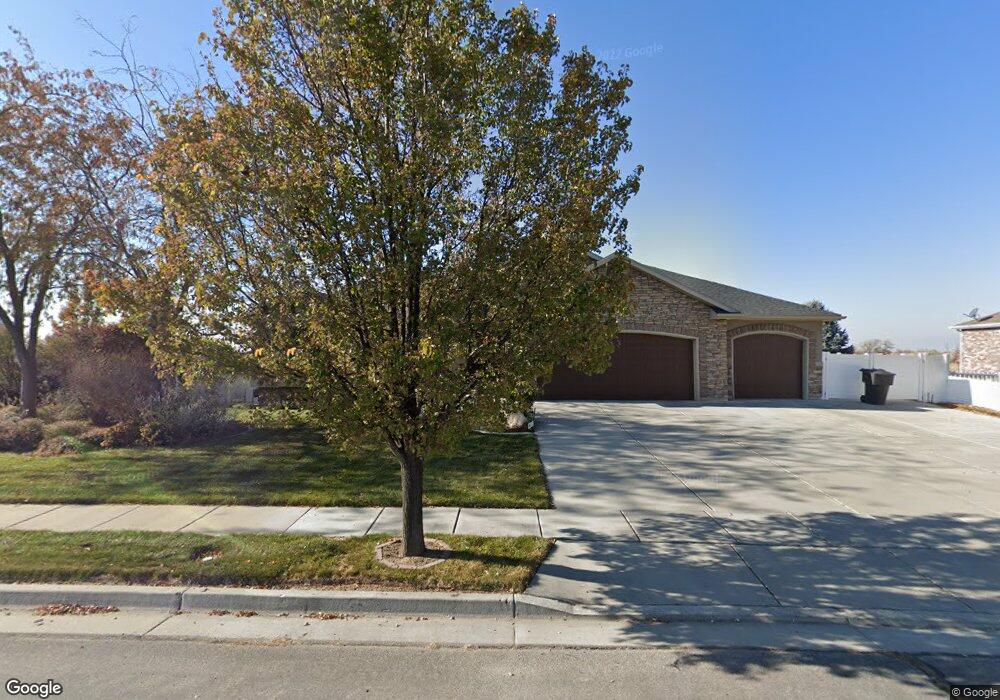
95 N 4950 W Clearfield, UT 84015
Estimated Value: $594,000 - $714,000
--
Bed
4
Baths
1,614
Sq Ft
$394/Sq Ft
Est. Value
About This Home
This home is located at 95 N 4950 W, Clearfield, UT 84015 and is currently estimated at $635,326, approximately $393 per square foot. 95 N 4950 W is a home with nearby schools including West Point School, West Point Junior High School, and Syracuse High School.
Ownership History
Date
Name
Owned For
Owner Type
Purchase Details
Closed on
Oct 25, 2004
Sold by
Anderson Craig John and Anderson Colette F
Bought by
Anderson Craig J and Anderson Colette F
Current Estimated Value
Home Financials for this Owner
Home Financials are based on the most recent Mortgage that was taken out on this home.
Original Mortgage
$10,000
Outstanding Balance
$4,943
Interest Rate
5.74%
Mortgage Type
Credit Line Revolving
Estimated Equity
$630,383
Purchase Details
Closed on
Feb 11, 2004
Sold by
Paice Farms Llc
Bought by
Anderson Craig John and Anderson Colette F
Purchase Details
Closed on
Apr 16, 2003
Sold by
Mark Higley Construction Lc and Boothe Gordon
Bought by
Paice Farms Llc
Home Financials for this Owner
Home Financials are based on the most recent Mortgage that was taken out on this home.
Original Mortgage
$850,000
Interest Rate
6.22%
Mortgage Type
Seller Take Back
Create a Home Valuation Report for This Property
The Home Valuation Report is an in-depth analysis detailing your home's value as well as a comparison with similar homes in the area
Home Values in the Area
Average Home Value in this Area
Purchase History
| Date | Buyer | Sale Price | Title Company |
|---|---|---|---|
| Anderson Craig J | -- | Bonneville Title Company Inc | |
| Anderson Craig John | -- | Heritage West Title Insuranc | |
| Paice Farms Llc | -- | Heritage West Title Insuranc |
Source: Public Records
Mortgage History
| Date | Status | Borrower | Loan Amount |
|---|---|---|---|
| Open | Anderson Craig J | $10,000 | |
| Previous Owner | Paice Farms Llc | $850,000 |
Source: Public Records
Tax History Compared to Growth
Tax History
| Year | Tax Paid | Tax Assessment Tax Assessment Total Assessment is a certain percentage of the fair market value that is determined by local assessors to be the total taxable value of land and additions on the property. | Land | Improvement |
|---|---|---|---|---|
| 2025 | $3,460 | $318,450 | $112,687 | $205,763 |
| 2024 | $3,327 | $307,450 | $101,452 | $205,998 |
| 2023 | $3,237 | $550,000 | $126,380 | $423,620 |
| 2022 | $3,517 | $327,250 | $65,716 | $261,534 |
| 2021 | $3,199 | $445,000 | $102,765 | $342,235 |
| 2020 | $2,832 | $388,000 | $86,316 | $301,684 |
| 2019 | $2,749 | $371,000 | $83,748 | $287,252 |
| 2018 | $2,551 | $339,000 | $83,784 | $255,216 |
| 2016 | $2,233 | $155,705 | $32,416 | $123,289 |
| 2015 | $2,239 | $147,950 | $32,416 | $115,534 |
| 2014 | $2,028 | $135,560 | $32,416 | $103,144 |
| 2013 | -- | $131,717 | $31,811 | $99,906 |
Source: Public Records
Map
Nearby Homes
- 4669 W 75 N
- 4594 W 75 N Unit 405
- 128 N 4500 W
- 477 N 4500 W
- 4719 W 650 N
- 4366 W 200 N
- 4325 W 75 N
- 4352 W 300 N
- 4362 West St Unit 106
- 4358 West St Unit 105
- 120 N 4325 W
- 356 S 4300 W Unit 611
- 364 S 4300 W Unit 610
- 696 S 4500 W
- 357 N 4000 W
- 3949 W 250 N
- 3851 W 50 S Unit 425
- 3849 W 50 S Unit 426
- 3847 W 50 S Unit 428
- 4443 W 920 S Unit 110