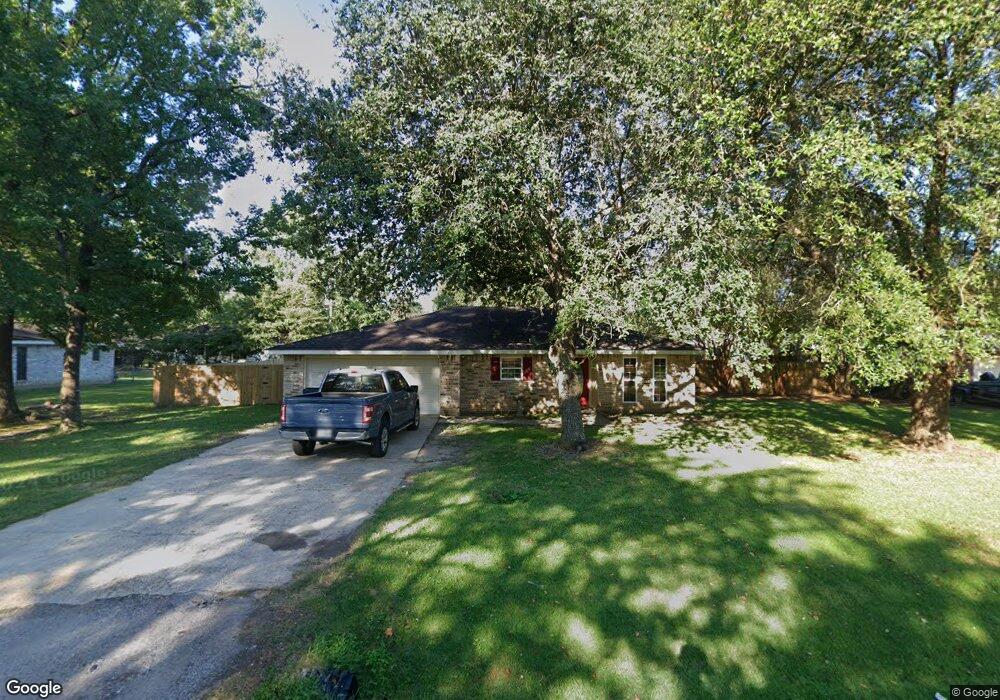
95 Park Place Lumberton, TX 77657
Estimated Value: $230,959 - $250,000
3
Beds
2
Baths
1,575
Sq Ft
$153/Sq Ft
Est. Value
About This Home
This home is located at 95 Park Place, Lumberton, TX 77657 and is currently estimated at $241,740, approximately $153 per square foot. 95 Park Place is a home located in Hardin County with nearby schools including Lumberton Primary School, Lumberton Intermediate School, and Lumberton Middle School.
Ownership History
Date
Name
Owned For
Owner Type
Purchase Details
Closed on
May 2, 2014
Sold by
Clark Bobby
Bought by
Pendino Thomas and Pendino Teresa
Current Estimated Value
Purchase Details
Closed on
Apr 25, 2014
Sold by
Clark Katy
Bought by
Clark Bobby
Purchase Details
Closed on
Aug 18, 2010
Sold by
Harvill Donald and Harvill Angela
Bought by
Clark Katy and Clark Bobby
Home Financials for this Owner
Home Financials are based on the most recent Mortgage that was taken out on this home.
Original Mortgage
$137,843
Interest Rate
4.54%
Mortgage Type
FHA
Purchase Details
Closed on
Jul 20, 2007
Sold by
Peden Robert S and Peden Stacy L
Bought by
Harvill Donald
Home Financials for this Owner
Home Financials are based on the most recent Mortgage that was taken out on this home.
Original Mortgage
$102,400
Interest Rate
6.71%
Mortgage Type
Purchase Money Mortgage
Create a Home Valuation Report for This Property
The Home Valuation Report is an in-depth analysis detailing your home's value as well as a comparison with similar homes in the area
Home Values in the Area
Average Home Value in this Area
Purchase History
| Date | Buyer | Sale Price | Title Company |
|---|---|---|---|
| Pendino Thomas | -- | Stewart Title | |
| Clark Bobby | -- | Stewart Title | |
| Clark Katy | -- | None Available | |
| Harvill Donald | -- | None Available |
Source: Public Records
Mortgage History
| Date | Status | Borrower | Loan Amount |
|---|---|---|---|
| Previous Owner | Clark Katy | $137,843 | |
| Previous Owner | Harvill Donald | $102,400 | |
| Closed | Clark Bobby | $0 |
Source: Public Records
Tax History Compared to Growth
Tax History
| Year | Tax Paid | Tax Assessment Tax Assessment Total Assessment is a certain percentage of the fair market value that is determined by local assessors to be the total taxable value of land and additions on the property. | Land | Improvement |
|---|---|---|---|---|
| 2024 | $2,068 | $188,543 | $42,000 | $146,543 |
| 2023 | $2,038 | $181,223 | $42,000 | $148,741 |
| 2022 | $3,322 | $179,235 | $39,600 | $139,635 |
| 2021 | $2,815 | $164,500 | $39,600 | $124,900 |
| 2020 | $2,559 | $136,150 | $39,600 | $96,550 |
| 2019 | $2,488 | $128,040 | $39,600 | $88,440 |
| 2018 | $2,023 | $128,040 | $39,600 | $88,440 |
| 2017 | $2,368 | $120,000 | $39,600 | $80,400 |
| 2016 | $2,368 | $120,000 | $39,600 | $80,400 |
| 2015 | $2,368 | $120,000 | $39,600 | $80,400 |
| 2014 | $2,023 | $120,000 | $39,600 | $80,400 |
Source: Public Records
Map
Nearby Homes
- 7621 Clearview Ln
- 90 Lamplighter St
- 125 Williams Rd
- 404 Birch View Dr
- 7625 Sir Kevin
- 337 S Main St
- 303 Winding Brook Dr
- 124 River Birch Cir
- 1520 Kalas Cir
- 490 Hidden Grove Ct
- 7689 South Boardwalk
- 10 Dana St
- 1760 Kala's Cir
- 246 Raider Ln
- 1360 Jared Dr
- 1310 Natasha's Way
- 1710 Kalas Cir
- 1350 Jared Dr
- 1335 Natashas Way
- 1325 Natashas Way
- 85 Park Place
- 105 Park Place
- 90 Candlelight Ln
- 90 Park Place
- 80 Candlelight Ln
- 80 Park Place
- 75 Park Place
- 70 Candlelight Ln
- 160 Parkway Dr
- 70 Park Place
- 150 Parkway
- 105 Candlelight Ln
- 170 Parkway Dr
- 95 Candlelight Ln
- 95 Idlewild St
- 115 Candlelight Ln
- 140 Parkway Dr
- 115 Idlewild St
- 65 Park Place
- 85 Candlelight Ln