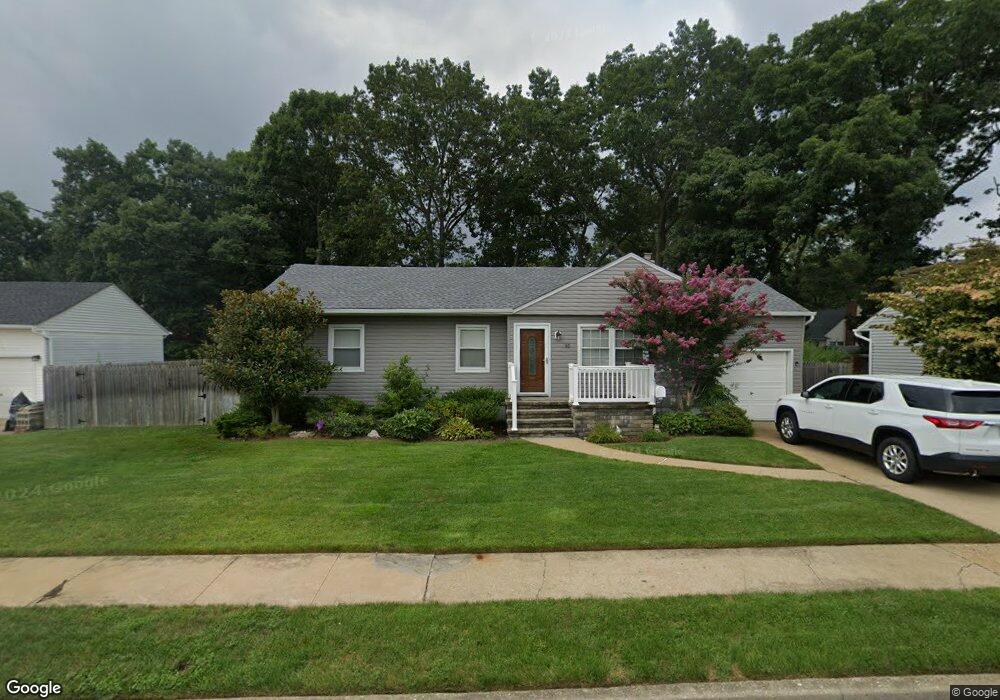
95 Rhode Island Ave Massapequa, NY 11758
Estimated Value: $702,937 - $739,000
3
Beds
1
Bath
1,248
Sq Ft
$578/Sq Ft
Est. Value
About This Home
This home is located at 95 Rhode Island Ave, Massapequa, NY 11758 and is currently estimated at $720,969, approximately $577 per square foot. 95 Rhode Island Ave is a home located in Nassau County with nearby schools including Charles E. Schwarting School, Plainedge Middle School, and Plainedge Senior High School.
Ownership History
Date
Name
Owned For
Owner Type
Purchase Details
Closed on
Aug 30, 2016
Sold by
Wilkens Brian P and Wilkens Elisa R
Bought by
Tranchina Antonelia and Tranchina Andre
Current Estimated Value
Home Financials for this Owner
Home Financials are based on the most recent Mortgage that was taken out on this home.
Original Mortgage
$369,000
Outstanding Balance
$294,743
Interest Rate
3.43%
Mortgage Type
New Conventional
Estimated Equity
$426,226
Purchase Details
Closed on
Mar 8, 2010
Sold by
Blomquist Douglas and Blomquist Bryan
Bought by
Wilkens Brian P and Wilkens Elisa R
Home Financials for this Owner
Home Financials are based on the most recent Mortgage that was taken out on this home.
Original Mortgage
$335,469
Interest Rate
5.12%
Mortgage Type
FHA
Purchase Details
Closed on
Mar 1, 2010
Sold by
Blomquist Douglas and Blomquist Bryan
Bought by
Blomquist Bryan and Blomquist Douglas
Home Financials for this Owner
Home Financials are based on the most recent Mortgage that was taken out on this home.
Original Mortgage
$335,469
Interest Rate
5.12%
Mortgage Type
FHA
Create a Home Valuation Report for This Property
The Home Valuation Report is an in-depth analysis detailing your home's value as well as a comparison with similar homes in the area
Home Values in the Area
Average Home Value in this Area
Purchase History
| Date | Buyer | Sale Price | Title Company |
|---|---|---|---|
| Tranchina Antonelia | $469,000 | Stewart Title Insurance Comp | |
| Wilkens Brian P | $376,000 | -- | |
| Blomquist Bryan | -- | -- |
Source: Public Records
Mortgage History
| Date | Status | Borrower | Loan Amount |
|---|---|---|---|
| Open | Tranchina Antonelia | $369,000 | |
| Previous Owner | Wilkens Brian P | $335,469 | |
| Previous Owner | Blomquist Bryan | $335,469 |
Source: Public Records
Tax History Compared to Growth
Tax History
| Year | Tax Paid | Tax Assessment Tax Assessment Total Assessment is a certain percentage of the fair market value that is determined by local assessors to be the total taxable value of land and additions on the property. | Land | Improvement |
|---|---|---|---|---|
| 2025 | $13,217 | $430 | $235 | $195 |
| 2024 | $3,585 | $444 | $242 | $202 |
| 2023 | $12,732 | $468 | $255 | $213 |
| 2022 | $12,732 | $467 | $255 | $212 |
| 2021 | $12,113 | $458 | $250 | $208 |
| 2020 | $12,123 | $574 | $573 | $1 |
| 2019 | $12,103 | $615 | $514 | $101 |
| 2018 | $12,221 | $752 | $0 | $0 |
| 2017 | $8,184 | $752 | $628 | $124 |
| 2016 | $11,842 | $752 | $628 | $124 |
| 2015 | $3,283 | $752 | $571 | $181 |
| 2014 | $3,283 | $752 | $571 | $181 |
| 2013 | $2,986 | $752 | $571 | $181 |
Source: Public Records
Map
Nearby Homes
- 73 Massachusetts Ave
- 101 Toronto Ave
- 121 Ontario Ave
- 102 Boston Ave
- 76 Hamilton Ave
- 86 Cleveland Ave
- 20 Boston Ave
- 70 Pittsburgh Ave
- 22 Commonwealth Ave
- 163 Massachusetts Ave
- 11 Pittsburgh Ave
- 598 N Suffolk Ave
- 73 Chicago Ave
- 254 N Richmond Ave
- 4030 Jerusalem Ave Unit 1B
- 136 Euclid Ave
- 1427 Washington Ave
- 558 N Hawthorne St
- 104 Clark Ave
- 530 N Hawthorne St
- 93 Rhode Island Ave
- 104 New Hampshire Ave
- 106 New Hampshire Ave
- 102 New Hampshire Ave
- 91 Rhode Island Ave
- 94 Rhode Island Ave
- 99 Rhode Island Ave
- 114 New Hampshire Ave
- 92 Rhode Island Ave
- 96 Rhode Island Ave
- 98 New Hampshire Ave
- 98 Rhode Island Ave
- 90 Rhode Island Ave
- 89 Rhode Island Ave
- 100 New Hampshire Ave
- 101 Rhode Island Ave
- 93 Commonwealth Ave
- 95 New Hampshire Ave
- 93 New Hampshire Ave
- 95 Commonwealth Ave