95 River St Belchertown, MA 01007
Belchertown AreaEstimated Value: $378,000 - $531,000
About This Home
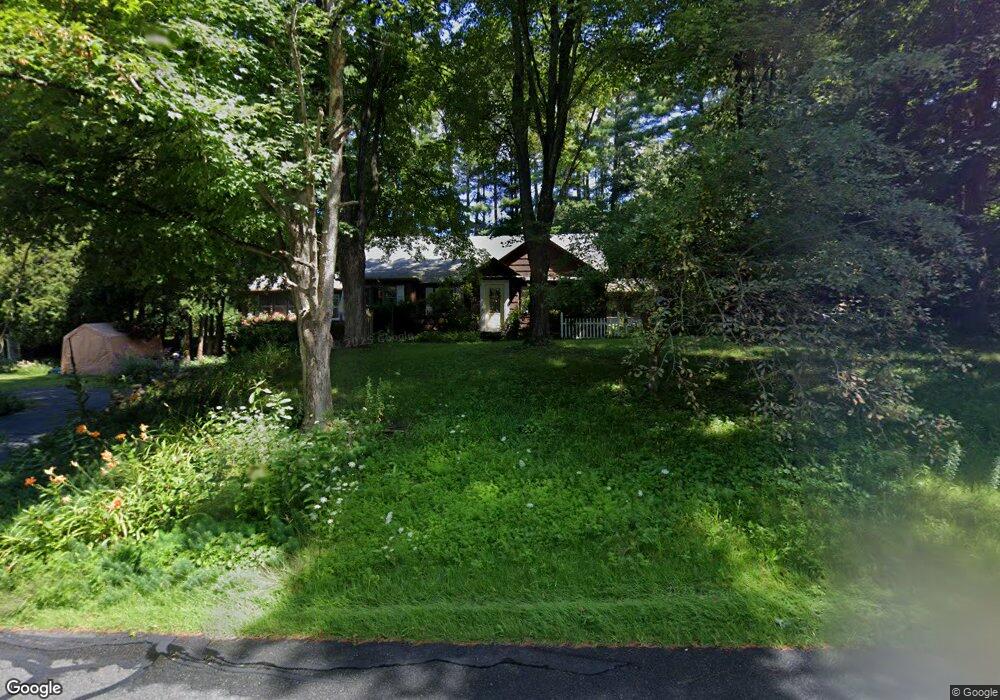
This home is located at 95 River St, Belchertown, MA 01007 and is currently estimated at $454,480, approximately $163 per square foot. 95 River St is a home located in Hampshire County with nearby schools including Swift River Elementary School, Chestnut Hill Community School, and Jabish Middle School.
Ownership History
We collect this data history from publicly available records. To have your information removed, we recommend requesting removal directly through your county’s website.
Purchase Details
Home Values in the Area
Average Home Value in this Area
Purchase History
We collect this data history from publicly available records. To have your information removed, we recommend requesting removal directly through your county’s website.
| Date | Buyer | Sale Price | Title Company |
|---|---|---|---|
| $135,000 | -- |
Mortgage History
We collect this data history from publicly available records. To have your information removed, we recommend requesting removal directly through your county’s website.
| Date | Status | Borrower | Loan Amount |
|---|---|---|---|
| Open | $128,000 | ||
| Closed | $24,600 |
Tax History
We collect this data history from publicly available records. To have your information removed, we recommend requesting removal directly through your county’s website.
| Year | Tax Paid | Tax Assessment Tax Assessment Total Assessment is a certain percentage of the fair market value that is determined by local assessors to be the total taxable value of land and additions on the property. | Land | Improvement |
|---|---|---|---|---|
| 2025 | $4,655 | $320,800 | $70,900 | $249,900 |
| 2024 | $4,473 | $292,000 | $64,300 | $227,700 |
| 2023 | $4,295 | $263,200 | $58,900 | $204,300 |
| 2022 | $4,763 | $269,700 | $58,900 | $210,800 |
| 2021 | $4,641 | $256,000 | $58,900 | $197,100 |
| 2020 | $4,444 | $244,600 | $58,900 | $185,700 |
| 2019 | $4,201 | $229,300 | $58,900 | $170,400 |
| 2018 | $4,102 | $225,500 | $60,100 | $165,400 |
| 2017 | $4,053 | $222,700 | $60,100 | $162,600 |
| 2016 | $3,995 | $222,300 | $60,100 | $162,200 |
| 2015 | $4,054 | $226,600 | $60,100 | $166,500 |
Map
- 45 River St
- 4 Depot St
- 18 Depot St
- 10 Keyes St
- 0 South St
- 18 Pine St
- 3162 Main St Unit 3162
- 47 Fuller Rd
- 6 High Bluff Rd
- 5 Sunny Crest Ln
- 0 Sunny Crest Ln
- 24 Sunny Crest Ln
- 10 Sunny Crest Ln
- 3157-3159 Main St
- 7 High Bluff Rd
- 39 High Bluff Rd
- 71 High Bluff Rd
- 63 High Bluff Rd
- 48 High Bluff Rd
- 57 High Bluff Rd
Ask me questions while you tour the home.