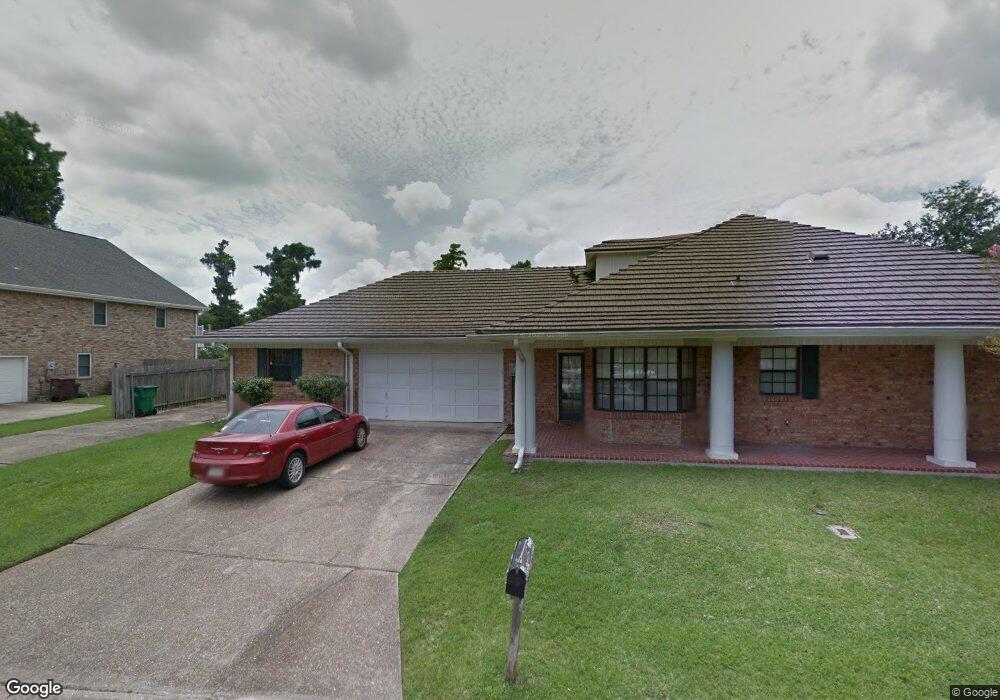
95 Rosedown Dr Destrehan, LA 70047
Estimated Value: $400,000 - $412,000
--
Bed
--
Bath
3,050
Sq Ft
$133/Sq Ft
Est. Value
About This Home
This home is located at 95 Rosedown Dr, Destrehan, LA 70047 and is currently estimated at $406,697, approximately $133 per square foot. 95 Rosedown Dr is a home located in St. Charles Parish with nearby schools including New Sarpy Elementary School, Ethel Schoeffner Elementary School, and Destrehan High School.
Ownership History
Date
Name
Owned For
Owner Type
Purchase Details
Closed on
Aug 17, 2023
Sold by
Glore Alice Phillips and Glore Michael H
Bought by
Mccarthy Matthew Michael and Coe Kara Suzanne
Current Estimated Value
Home Financials for this Owner
Home Financials are based on the most recent Mortgage that was taken out on this home.
Original Mortgage
$333,450
Outstanding Balance
$325,852
Interest Rate
6.81%
Mortgage Type
New Conventional
Estimated Equity
$80,845
Purchase Details
Closed on
Jan 30, 2009
Sold by
Glore Michael H
Bought by
Glore Alice Phillips
Create a Home Valuation Report for This Property
The Home Valuation Report is an in-depth analysis detailing your home's value as well as a comparison with similar homes in the area
Home Values in the Area
Average Home Value in this Area
Purchase History
| Date | Buyer | Sale Price | Title Company |
|---|---|---|---|
| Mccarthy Matthew Michael | $351,000 | Property Title | |
| Glore Alice Phillips | -- | St Charles Title Insurance A |
Source: Public Records
Mortgage History
| Date | Status | Borrower | Loan Amount |
|---|---|---|---|
| Open | Mccarthy Matthew Michael | $333,450 |
Source: Public Records
Tax History Compared to Growth
Tax History
| Year | Tax Paid | Tax Assessment Tax Assessment Total Assessment is a certain percentage of the fair market value that is determined by local assessors to be the total taxable value of land and additions on the property. | Land | Improvement |
|---|---|---|---|---|
| 2024 | $2,397 | $30,900 | $14,590 | $16,310 |
| 2023 | $2,397 | $24,478 | $8,130 | $16,348 |
| 2022 | $2,854 | $24,478 | $8,130 | $16,348 |
| 2021 | $2,591 | $22,030 | $7,317 | $14,713 |
| 2020 | $2,876 | $24,478 | $8,130 | $16,348 |
| 2019 | $2,846 | $24,069 | $7,278 | $16,791 |
| 2018 | $2,824 | $24,069 | $7,278 | $16,791 |
| 2017 | $2,824 | $24,069 | $7,278 | $16,791 |
| 2016 | $2,836 | $24,069 | $7,278 | $16,791 |
| 2015 | $1,481 | $20,130 | $3,339 | $16,791 |
| 2014 | $1,426 | $20,130 | $3,339 | $16,791 |
| 2013 | $1,431 | $20,130 | $3,339 | $16,791 |
Source: Public Records
Map
Nearby Homes