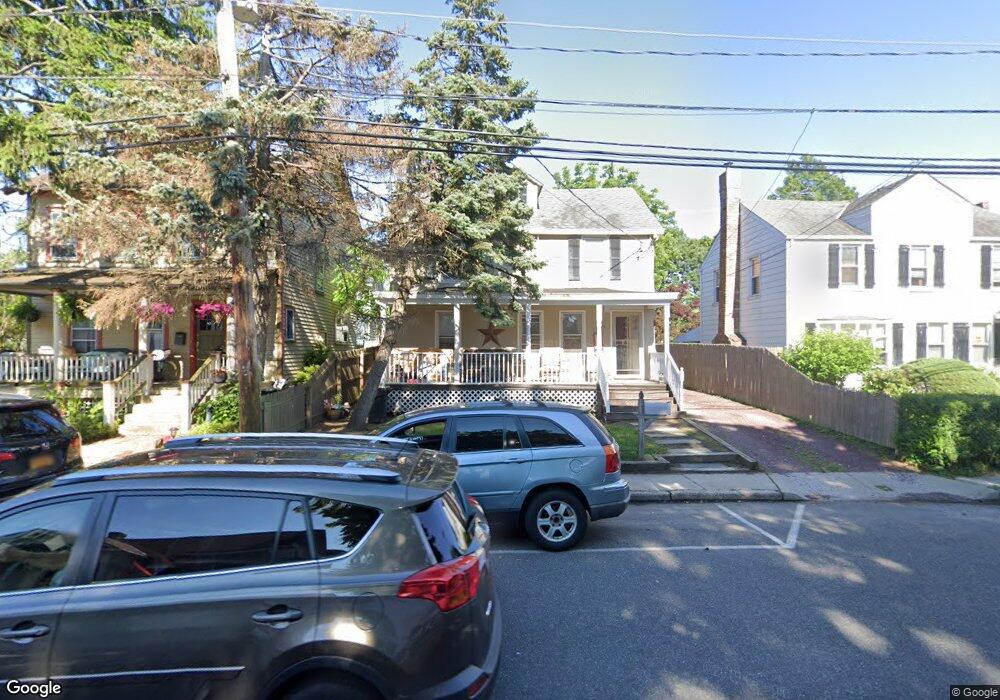
95 Roslyn Ave Sea Cliff, NY 11579
Estimated Value: $868,990 - $879,000
3
Beds
2
Baths
1,491
Sq Ft
$586/Sq Ft
Est. Value
About This Home
This home is located at 95 Roslyn Ave, Sea Cliff, NY 11579 and is currently estimated at $873,995, approximately $586 per square foot. 95 Roslyn Ave is a home located in Nassau County with nearby schools including North Shore Middle School, North Shore Senior High School, and Tiegerman Elementary School.
Ownership History
Date
Name
Owned For
Owner Type
Purchase Details
Closed on
Sep 7, 2016
Sold by
Ricci Joseph and Ricci Maryann
Bought by
Revocable Declaration Of Trust Of Joseph and Revocable Declaration Of Trust Of Mary A
Current Estimated Value
Purchase Details
Closed on
Aug 4, 2014
Sold by
Antico Linda S
Bought by
Ricci Joseph and Rici Mary Ann
Purchase Details
Closed on
Jul 11, 1996
Sold by
Young Stanley
Bought by
Antico Philip and Antico Linda
Home Financials for this Owner
Home Financials are based on the most recent Mortgage that was taken out on this home.
Original Mortgage
$139,400
Interest Rate
8.37%
Create a Home Valuation Report for This Property
The Home Valuation Report is an in-depth analysis detailing your home's value as well as a comparison with similar homes in the area
Home Values in the Area
Average Home Value in this Area
Purchase History
| Date | Buyer | Sale Price | Title Company |
|---|---|---|---|
| Revocable Declaration Of Trust Of Joseph | -- | None Available | |
| Ricci Joseph | $375,000 | Fidelity National Title | |
| Antico Philip | $175,000 | -- |
Source: Public Records
Mortgage History
| Date | Status | Borrower | Loan Amount |
|---|---|---|---|
| Previous Owner | Antico Philip | $139,400 |
Source: Public Records
Tax History Compared to Growth
Tax History
| Year | Tax Paid | Tax Assessment Tax Assessment Total Assessment is a certain percentage of the fair market value that is determined by local assessors to be the total taxable value of land and additions on the property. | Land | Improvement |
|---|---|---|---|---|
| 2025 | $12,274 | $593 | $200 | $393 |
| 2024 | $2,467 | $593 | $200 | $393 |
| 2023 | $11,771 | $593 | $200 | $393 |
| 2022 | $11,771 | $593 | $200 | $393 |
| 2021 | $11,374 | $587 | $198 | $389 |
| 2020 | $11,192 | $930 | $886 | $44 |
| 2019 | $10,545 | $930 | $886 | $44 |
| 2018 | $9,992 | $903 | $0 | $0 |
| 2017 | $8,609 | $1,157 | $886 | $271 |
| 2016 | $11,486 | $1,157 | $886 | $271 |
| 2015 | $2,486 | $1,157 | $886 | $271 |
| 2014 | $2,486 | $1,157 | $886 | $271 |
| 2013 | $2,348 | $1,157 | $886 | $271 |
Source: Public Records
Map
Nearby Homes