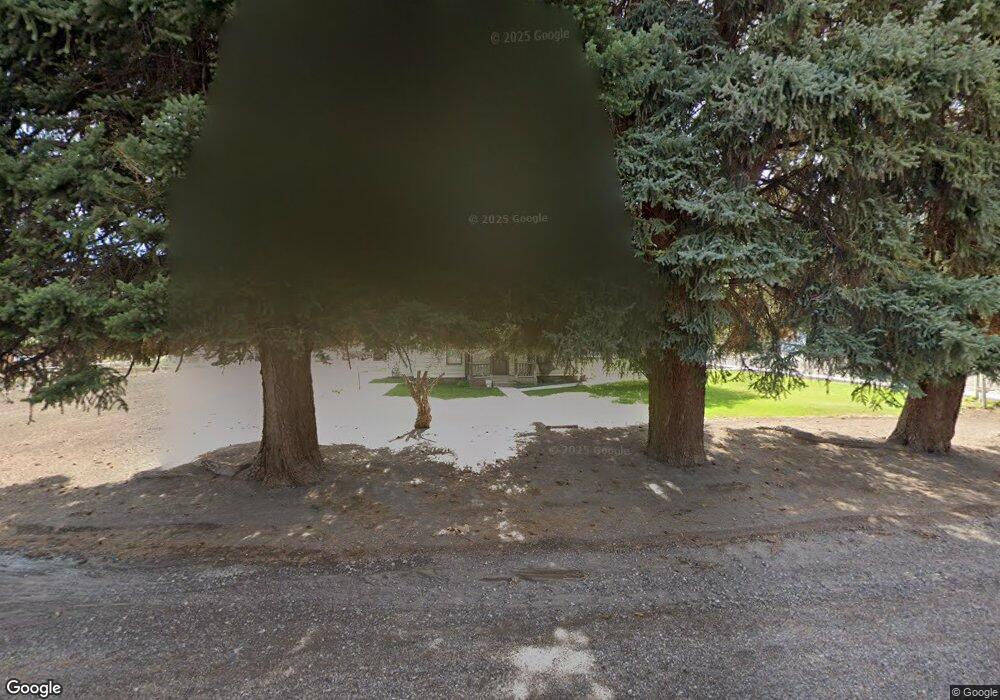
95 S 200 E Monroe, UT 84754
Monroe NeighborhoodEstimated Value: $251,000 - $325,840
Studio
--
Bath
1,423
Sq Ft
$206/Sq Ft
Est. Value
About This Home
This home is located at 95 S 200 E, Monroe, UT 84754 and is currently estimated at $293,210, approximately $206 per square foot. 95 S 200 E is a home located in Sevier County with nearby schools including Monroe School, South Sevier Middle School, and South Sevier High School.
Ownership History
Date
Name
Owned For
Owner Type
Purchase Details
Closed on
Nov 1, 2024
Sold by
Utley Family Trust and Utley Joshua
Bought by
Carter Brooklyn L and Payne Carrie Jaimi
Current Estimated Value
Home Financials for this Owner
Home Financials are based on the most recent Mortgage that was taken out on this home.
Original Mortgage
$199,180
Outstanding Balance
$196,568
Interest Rate
6.09%
Mortgage Type
FHA
Estimated Equity
$96,642
Purchase Details
Closed on
Oct 30, 2024
Sold by
Utley Family Trust and Utley Joshua
Bought by
Utley Joshua and Utley Tasha
Home Financials for this Owner
Home Financials are based on the most recent Mortgage that was taken out on this home.
Original Mortgage
$199,180
Outstanding Balance
$196,568
Interest Rate
6.09%
Mortgage Type
FHA
Estimated Equity
$96,642
Purchase Details
Closed on
Jun 3, 2021
Sold by
Utley Ronald D
Bought by
Utley Ronald D and Utley Family Trust
Create a Home Valuation Report for This Property
The Home Valuation Report is an in-depth analysis detailing your home's value as well as a comparison with similar homes in the area
Home Values in the Area
Average Home Value in this Area
Purchase History
| Date | Buyer | Sale Price | Title Company |
|---|---|---|---|
| Carter Brooklyn L | -- | First American Title | |
| Carter Brooklyn L | -- | First American Title | |
| Utley Joshua | -- | Professional Title | |
| Utley Joshua | -- | Professional Title | |
| Utley Ronald D | -- | None Available |
Source: Public Records
Mortgage History
| Date | Status | Borrower | Loan Amount |
|---|---|---|---|
| Open | Carter Brooklyn L | $199,180 | |
| Closed | Carter Brooklyn L | $199,180 |
Source: Public Records
Tax History
| Year | Tax Paid | Tax Assessment Tax Assessment Total Assessment is a certain percentage of the fair market value that is determined by local assessors to be the total taxable value of land and additions on the property. | Land | Improvement |
|---|---|---|---|---|
| 2025 | $1,023 | $113,614 | $35,581 | $78,033 |
| 2024 | $1,023 | $149,020 | $37,803 | $111,217 |
| 2023 | $1,365 | $138,356 | $36,914 | $101,442 |
| 2022 | $1,455 | $137,879 | $29,143 | $108,736 |
| 2021 | $1,191 | $93,386 | $21,021 | $72,365 |
| 2020 | $1,132 | $83,183 | $20,020 | $63,163 |
| 2019 | $1,007 | $77,760 | $18,020 | $59,740 |
| 2018 | $1,027 | $70,510 | $16,020 | $54,490 |
| 2017 | $969 | $69,080 | $17,220 | $51,860 |
| 2016 | $669 | $65,160 | $0 | $0 |
| 2015 | $669 | $65,160 | $0 | $0 |
| 2014 | $669 | $65,160 | $0 | $0 |
Source: Public Records
Map
Nearby Homes
Your Personal Tour Guide
Ask me questions while you tour the home.