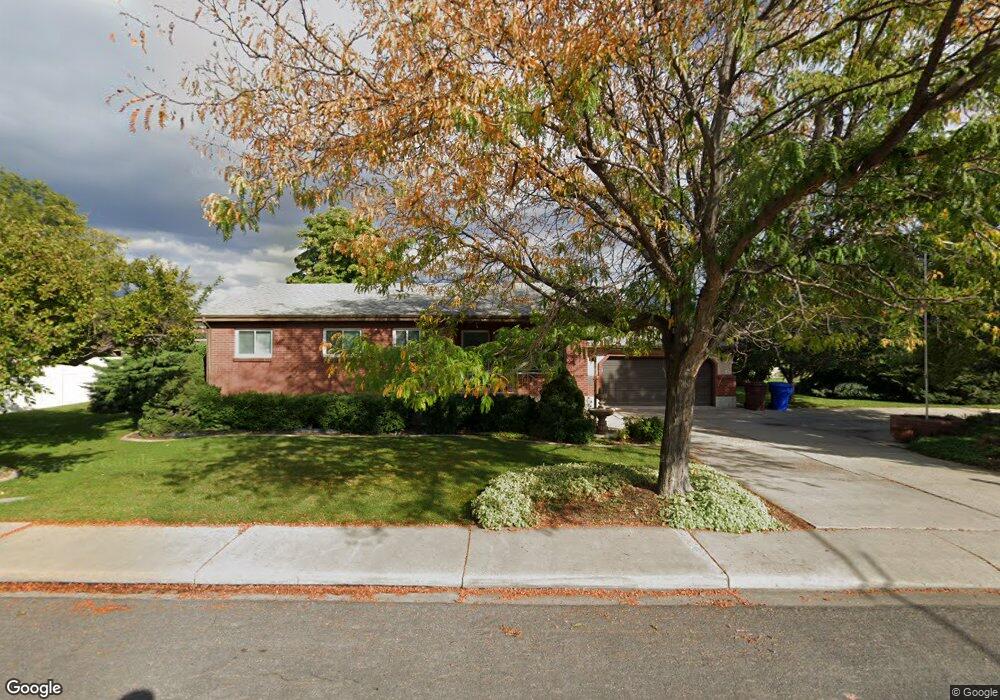
95 S 800 W Orem, UT 84058
Orem Park NeighborhoodEstimated Value: $540,000 - $588,000
4
Beds
3
Baths
2,764
Sq Ft
$205/Sq Ft
Est. Value
About This Home
This home is located at 95 S 800 W, Orem, UT 84058 and is currently estimated at $567,221, approximately $205 per square foot. 95 S 800 W is a home located in Utah County with nearby schools including Orem Elementary School, Orem Junior High School, and Mountain View High School.
Ownership History
Date
Name
Owned For
Owner Type
Purchase Details
Closed on
Jun 16, 2020
Sold by
Vanleeuwen Nicolas and Vanleeuwen Van Leeuwen
Bought by
Vanleeuwen Breelyn Jan and Vanleeuwen Van Leeuwen
Current Estimated Value
Home Financials for this Owner
Home Financials are based on the most recent Mortgage that was taken out on this home.
Original Mortgage
$172,750
Outstanding Balance
$153,130
Interest Rate
3.2%
Mortgage Type
New Conventional
Estimated Equity
$414,091
Purchase Details
Closed on
Jul 11, 2012
Sold by
Stoffers Craig J
Bought by
Vanvanleeuwen Nicolaas Van
Home Financials for this Owner
Home Financials are based on the most recent Mortgage that was taken out on this home.
Original Mortgage
$201,286
Interest Rate
3.5%
Mortgage Type
FHA
Create a Home Valuation Report for This Property
The Home Valuation Report is an in-depth analysis detailing your home's value as well as a comparison with similar homes in the area
Home Values in the Area
Average Home Value in this Area
Purchase History
| Date | Buyer | Sale Price | Title Company |
|---|---|---|---|
| Vanleeuwen Breelyn Jan | -- | Trident Title Ins Agency Llc | |
| Vanvanleeuwen Nicolaas Van | -- | Wasatch Title Insurance Agen |
Source: Public Records
Mortgage History
| Date | Status | Borrower | Loan Amount |
|---|---|---|---|
| Open | Vanleeuwen Breelyn Jan | $172,750 | |
| Closed | Vanvanleeuwen Nicolaas Van | $201,286 |
Source: Public Records
Tax History
| Year | Tax Paid | Tax Assessment Tax Assessment Total Assessment is a certain percentage of the fair market value that is determined by local assessors to be the total taxable value of land and additions on the property. | Land | Improvement |
|---|---|---|---|---|
| 2025 | $2,161 | $295,130 | -- | -- |
| 2024 | $2,161 | $264,220 | $0 | $0 |
| 2023 | $1,983 | $260,645 | $0 | $0 |
| 2022 | $1,965 | $250,140 | $0 | $0 |
| 2021 | $1,827 | $352,300 | $195,400 | $156,900 |
| 2020 | $1,636 | $310,100 | $156,300 | $153,800 |
| 2019 | $1,465 | $288,800 | $144,300 | $144,500 |
| 2018 | $1,375 | $259,000 | $124,300 | $134,700 |
| 2017 | $1,294 | $130,570 | $0 | $0 |
| 2016 | $1,203 | $111,870 | $0 | $0 |
| 2015 | $1,170 | $102,905 | $0 | $0 |
| 2014 | $1,149 | $100,650 | $0 | $0 |
Source: Public Records
Map
Nearby Homes
- 896 W 30 S
- 237 S Ridgeview Dr
- 45 N 970 W
- 565 W 40 N
- 508 W 40 N
- 935 W 360 S
- 155 S 1200 W Unit 69
- 155 S 1200 W Unit 6
- 155 S 1200 W Unit 97
- 365 S 1015 W
- 148 S 400 W
- 216 S 400 W
- 506 S 800 West St Unit 13
- 162 N 450 W Unit 2
- 520 S 800 W Unit 14
- 278 S 1160 W
- 62 N 380 W
- 64 S 320 W
- 570 S 800 West St Unit 15
- 350 S 1200 W Unit 2
Your Personal Tour Guide
Ask me questions while you tour the home.