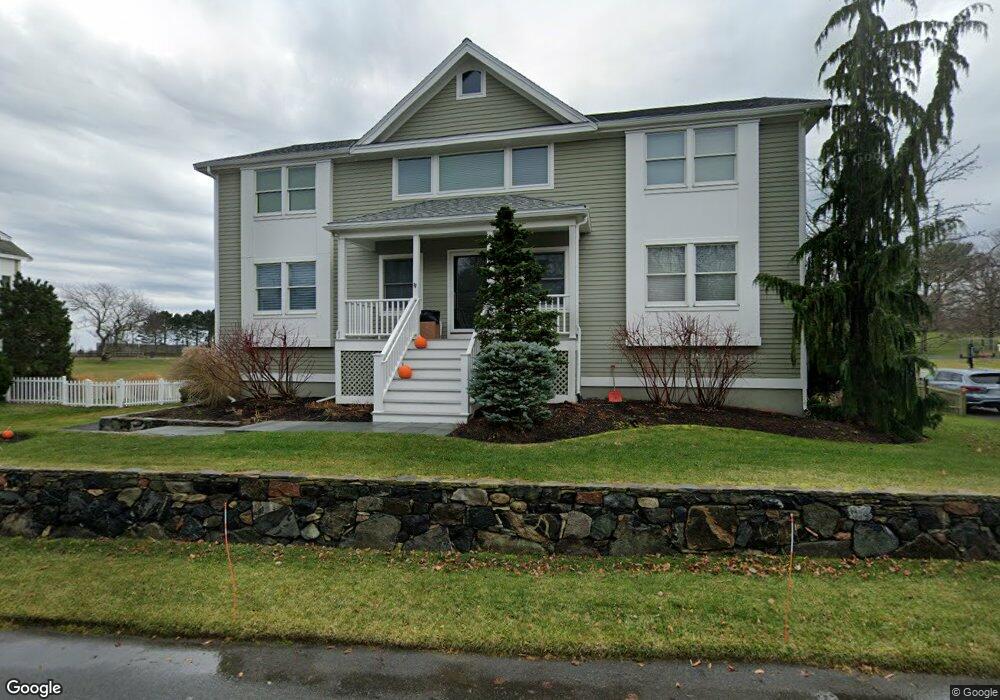
95 Seaview Ave Marblehead, MA 01945
Estimated Value: $1,474,000 - $1,742,000
3
Beds
3
Baths
3,528
Sq Ft
$460/Sq Ft
Est. Value
About This Home
This home is located at 95 Seaview Ave, Marblehead, MA 01945 and is currently estimated at $1,622,522, approximately $459 per square foot. 95 Seaview Ave is a home located in Essex County with nearby schools including Marblehead High School, Devereux School, and Epstein Hillel School.
Ownership History
Date
Name
Owned For
Owner Type
Purchase Details
Closed on
Nov 5, 2015
Sold by
Harsip Leslie
Bought by
Harsip Leslie and Harsip Michael
Current Estimated Value
Purchase Details
Closed on
Apr 20, 2011
Sold by
Harsip Michael and Harsip Leslie
Bought by
Harsip Leslie
Purchase Details
Closed on
Dec 19, 1995
Sold by
Assoc Preston Beach Lp
Bought by
Harsip Michael
Home Financials for this Owner
Home Financials are based on the most recent Mortgage that was taken out on this home.
Original Mortgage
$150,000
Interest Rate
7.43%
Mortgage Type
Purchase Money Mortgage
Create a Home Valuation Report for This Property
The Home Valuation Report is an in-depth analysis detailing your home's value as well as a comparison with similar homes in the area
Home Values in the Area
Average Home Value in this Area
Purchase History
| Date | Buyer | Sale Price | Title Company |
|---|---|---|---|
| Harsip Leslie | -- | -- | |
| Harsip Leslie | -- | -- | |
| Harsip Michael | $471,500 | -- |
Source: Public Records
Mortgage History
| Date | Status | Borrower | Loan Amount |
|---|---|---|---|
| Previous Owner | Harsip Michael | $16,800 | |
| Previous Owner | Harsip Michael | $75,000 | |
| Previous Owner | Harsip Michael | $150,000 |
Source: Public Records
Tax History
| Year | Tax Paid | Tax Assessment Tax Assessment Total Assessment is a certain percentage of the fair market value that is determined by local assessors to be the total taxable value of land and additions on the property. | Land | Improvement |
|---|---|---|---|---|
| 2025 | $14,611 | $1,614,500 | $636,500 | $978,000 |
| 2024 | $15,707 | $1,753,000 | $808,900 | $944,100 |
| 2023 | $13,410 | $1,341,000 | $590,100 | $750,900 |
| 2022 | $12,883 | $1,224,600 | $490,700 | $733,900 |
| 2021 | $12,253 | $1,175,900 | $464,100 | $711,800 |
| 2020 | $10,955 | $1,054,400 | $477,400 | $577,000 |
| 2019 | $10,647 | $991,300 | $437,600 | $553,700 |
| 2018 | $10,779 | $978,100 | $424,400 | $553,700 |
| 2017 | $10,331 | $938,300 | $384,600 | $553,700 |
| 2016 | $9,826 | $885,200 | $331,500 | $553,700 |
| 2015 | $9,547 | $861,600 | $305,000 | $556,600 |
| 2014 | $8,916 | $804,000 | $278,500 | $525,500 |
Source: Public Records
Map
Nearby Homes
- 272 Atlantic Ave
- 48 Bellevue Rd
- 212 Humphrey St Unit 205
- 37 Stanley Rd
- 12 Pickwick Rd
- 25 Tedesco St
- 2 Ocean Ave
- 4 Dean Rd
- 11 Angenica Terrace
- 24 Alden Rd
- 4 Gallison Ave
- 1002 Paradise Rd Unit PHE
- 6 Loring Hills Ave Unit D3
- 282 Pleasant St
- 71 Walnut Rd
- 110 Galloupes Point Rd
- 10 Arbutus Rd
- 3 Didio Dr
- 34 Moffatt Rd
- 49 Weatherly Dr
- 97 Seaview Ave
- 93 Seaview Ave
- 94 Seaview Ave
- 5 Preston Beach Rd
- 5 Preston Beach Rd
- 7 Preston Beach Rd
- 90 Seaview Ave
- 91 Seaview Ave
- 99 Seaview Ave
- 9 Preston Beach Rd
- 88 Seaview Ave
- 11 Preston Beach Rd
- 6 Preston Beach Rd
- 89 Seaview Ave
- 8 Preston Beach Rd
- 150 Beach Bluff Ave
- 150 Beach Bluff Ave Unit 1
- 150 Beach Bluff Ave
- 4 Preston Beach Rd
- 15 Preston Beach Rd
Your Personal Tour Guide
Ask me questions while you tour the home.