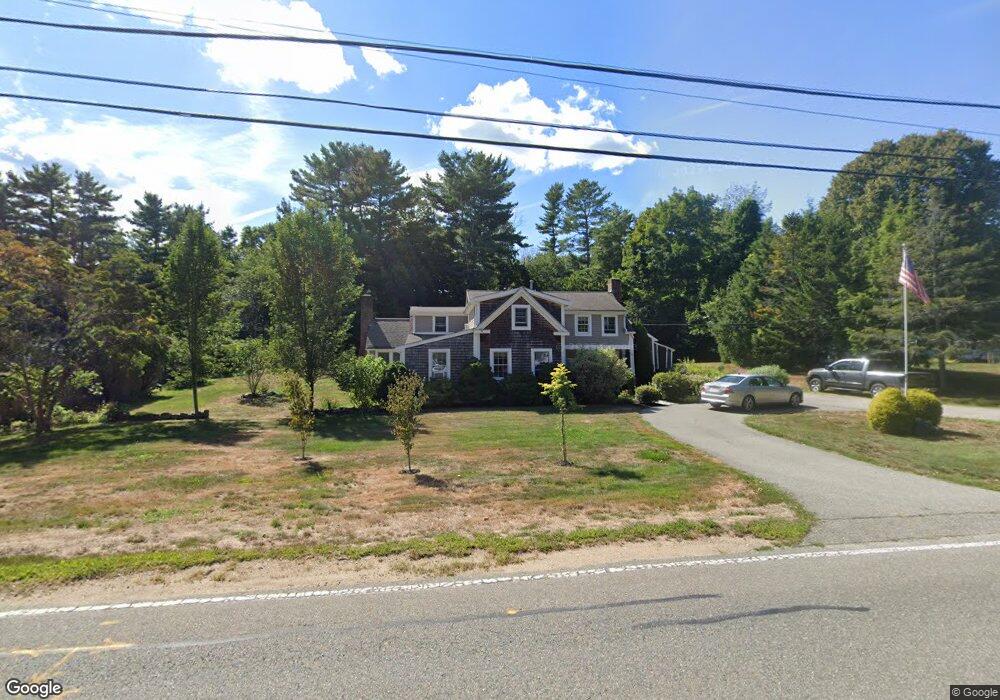
95 Spring St Hanover, MA 02339
Estimated Value: $807,581 - $1,012,000
4
Beds
3
Baths
2,616
Sq Ft
$341/Sq Ft
Est. Value
About This Home
This home is located at 95 Spring St, Hanover, MA 02339 and is currently estimated at $892,895, approximately $341 per square foot. 95 Spring St is a home located in Plymouth County with nearby schools including Hanover High School, Cadence Academy Preschool - Hanover, and The Master's Academy.
Ownership History
Date
Name
Owned For
Owner Type
Purchase Details
Closed on
Apr 27, 1992
Sold by
Oleary Michael J and Oleary Tamzen R
Bought by
Potvin Raymond A and Potvin Patricia A
Current Estimated Value
Create a Home Valuation Report for This Property
The Home Valuation Report is an in-depth analysis detailing your home's value as well as a comparison with similar homes in the area
Home Values in the Area
Average Home Value in this Area
Purchase History
| Date | Buyer | Sale Price | Title Company |
|---|---|---|---|
| Potvin Raymond A | $150,000 | -- |
Source: Public Records
Mortgage History
| Date | Status | Borrower | Loan Amount |
|---|---|---|---|
| Open | Potvin Raymond A | $328,000 | |
| Closed | Potvin Raymond A | $249,000 |
Source: Public Records
Tax History
| Year | Tax Paid | Tax Assessment Tax Assessment Total Assessment is a certain percentage of the fair market value that is determined by local assessors to be the total taxable value of land and additions on the property. | Land | Improvement |
|---|---|---|---|---|
| 2025 | $8,604 | $696,700 | $280,600 | $416,100 |
| 2024 | $8,345 | $649,900 | $280,600 | $369,300 |
| 2023 | $8,543 | $633,300 | $255,300 | $378,000 |
| 2022 | $8,908 | $584,100 | $255,300 | $328,800 |
| 2021 | $0 | $561,000 | $232,200 | $328,800 |
| 2020 | $0 | $556,100 | $232,200 | $323,900 |
| 2019 | $8,563 | $521,800 | $232,200 | $289,600 |
| 2018 | $8,342 | $512,400 | $232,200 | $280,200 |
| 2017 | $7,313 | $442,700 | $216,100 | $226,600 |
| 2016 | $6,977 | $413,800 | $196,500 | $217,300 |
| 2015 | $6,152 | $380,900 | $196,500 | $184,400 |
Source: Public Records
Map
Nearby Homes
- 250 Center St
- 33 1st Parish Ln
- 51 Cervelli Farm Dr
- 37 Dr
- 23 Cervelli Farm Dr
- 38 Cervelli Farm Dr
- 9 Cervelli Farm Dr
- 35 Sproul Rd
- 36 Grove St
- 70 Bardin St
- 114 Graham Hill Dr
- 365 Broadway
- 62 Larchmont Ln
- 68 East St
- 506 Main St
- 51 Farmside Dr
- 95 Tecumseh Dr
- 60 Summer Path Way
- 7 Farmside Dr
- 285 W Elm St
- 105 Spring St
- 100 Spring St
- 90 Spring St
- 79 Spring St
- 114 Spring St
- 74 Spring St
- 115 Candlewood Ln
- 69 Spring St
- 125 Candlewood Ln
- 122 Spring St
- 125 Spring St
- 109 Candlewood Ln
- 66 Spring St
- 32 Sheila Way
- 55 Spring St
- 133 Spring St
- 2 Spring Street Knoll
- 143 Candlewood Ln
- 58 Spring St
- 112 Candlewood Ln
Your Personal Tour Guide
Ask me questions while you tour the home.